The views expressed in this paper are those of the writer(s) and are not necessarily those of the ARJ Editor or Answers in Genesis.
Abstract
Thick chalk deposits exist in several parts of the world, including Europe, Australia, and the USA. The bulk of this chalk is considered to belong to what is referred to as the “Upper Cretaceous” period. Geologists working within a framework of uniformitarianism (or actualism) claim that they result from millions of years of accumulation of coccoliths. If we are to take the new understanding of the age of the earth from RATE studies seriously, then it is necessary to explain the chalk by mechanisms which do not involve such long timescales. Snelling (1994) attempted to explain the chalk deposits within a timescale of a few days, so that chalk could be considered as part of the visible evidence for the Noachian Flood. Tyler (1996) then tried to show that the model proposed by Snelling was not tenable and described how chalk had to be interpreted as a post-Flood deposit, but within a short timescale. This document shows two things. First, that the certain features of the “Upper Cretaceous” period correspond closely with the biblical account of the Noachian Flood around day 150. Second, that uniformitarian explanations for “chalk” are inadequate to explain their deposition, reworking, and geomorphology and that only by considering the rapid events in the middle of the Noachian Flood can their deposition and characteristics be explained. En passant we make two additional discoveries, viz (i) that the concept of the geological column is not robust over small distances, and (ii) that there is independent support to the RATE studies that show that the earth is young. A consequence of this geoscientific study is that geology is a powerful visible witness to the testimony of the Bible, and such facts should therefore be used in evangelism. Specifically, the real fossil record, rather than the constructed geological column, disproves evolution. The geoscience also shows that active promotion of what was commonly known as the European Recolonization Model (or its variants where the bulk of the strata are judged to be “post-Flood”) to explain geology was ill-founded.
Keywords: Chalk, Cretaceous, Deposition, Fossil order, Global flood, Oil reservoirs, Age of rocks
Introduction
Chalk deposits, up to a thousand meters thick, exist in many parts of the world, including Europe (from Ireland to Russia) and on to the Middle East (Egypt and Israel), the USA (Texas, Alabama, etc.) and Australia (Ager 1993). Uniformitarian geologists would consider that they were deposited during the “Upper Cretaceous” period when there was very little land. Funnell (1990) and Tyson and Funnel (1990) show the supposed European shoreline which seems to be at a maximum during the Campanian part of the “Cretaceous” period.
Geologists working within a uniformitarian framework (or actualism) explain chalk as the result of millions of years of growth and deposit of coccoliths (for example, Rawson 1992, p. 375). If we are to take the information from the RATE study (Vardiman, Snelling and Chaffin 2005) seriously then we must condense the depositional period to years rather than millions of years. Furthermore, if we additionally take the story of the Noachian Flood seriously, then it is necessary to consider whether the chalk can be explained by processes acting over a few days or a few years. Snelling (1994) attempted to explain the chalk deposits within a timescale of a few days so that it could be seen as part of the biblical Flood period. Tyler (1996) subsequently tried to show that the model proposed by Snelling was not tenable, and offered an alternative diluvialist view that the chalk had to be a post-Flood deposit,1 but could still be explained within a timescale of years (rather than millions of years). As an additional challenge to Snelling’s model, Ager (1993) makes the point that coccolith blooming releases large quantities of dimethyl sulfide. If this happened over a period of days, the atmosphere would be unbearable for Noah and his entourage.2
We first show that there are many similarities between the so-called “Upper Cretaceous” period defined by uniformitarian geology and the period around day 150 of the Noachian Flood. We then highlight the absence of a uniformitarian explanation (whatever the age of the rocks) for the origin of chalk deposits, and offer one that fits in with the short period available during the Flood for this deposition. One consequence is that all rocks below the chalk down to basement are Flood deposits.
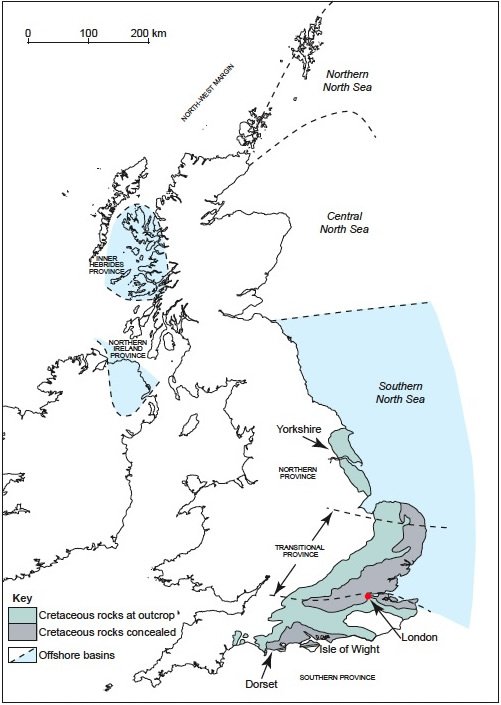
Fig. 1. The Chalk Provinces in the United Kingdom and North Sea, based on Mortimore et al. (2001).
In the process we will also show reasons from our study of chalk for challenging another uniformitarian sacred paradigm. This is the geological column on which so much of the insistence that the history of earth can be unravelled, and that in that unravelling process, evolution is thereby proved.
Specific examples will be taken from the large chalk basins dominating the southeast parts of the U.K. (including Dorset and Hampshire) and across the North Sea, as shown in Fig. 1. Supplementary evidence from wider parts of Europe will also be included.
Uniformitarianism
Before proceeding we need to review a few common terms. Hutton and Lyell were responsible for trying to explain geology without reference to the global Flood described in Genesis. They offered the view that the present is the key to the past, from which was coined the word uniformitarianism. Most modern geologists regard the biblical account of Creation and a global Flood as myth. However, they do accept that some degree of catastrophism has occurred at intervals during earth’s history. Phrases like methodological uniformitarianism (or just actualism) are used to describe this (Summerfield 1991), but the insistence is still that only processes that we now observe can be used to interpret geology (though rates may be substantially different to what we now experience). To that extent, they rule out a priori four points made in Genesis 6–9 which are not seen now, nor will be in the future, viz:
- There was a turbulent period in earth’s geological history lasting around one year which followed 120 years of opportunity to repent and/or cooperate with the building of the ark to avoid total loss of life;
- Major amounts of water were released by the fountains of the great deep;
- Major amounts of rain were released by the windows of heaven; and
- That event resulted in all the earth being submerged temporarily.
Neither Hutton, Lyell or anyone else who has followed their premises have systematically marshalled the evidence against there being better answers in Genesis for geology. Genesis has been sidelined, possibly because Genesis also contains metaphysical material, so only variations of uniformitarianism are allowed so as to avoid acknowledging the four points listed above. But the answers for chalk require us to examine Genesis as a premise if we are interested in truth rather than blinkering ourselves to the fact that God, even if He exists, has set a moral boundary for our lives.
Comparison of the “Upper Cretaceous” Period with the Noachian Flood
We now perform a holistic review of what is labeled as the “Upper Cretaceous” period through uniformitarian eyes, and compare that with the biblical record. To a secular geologist such as Ager (1996) or Hancock (1983), the Cretaceous period marks a watershed in earth’s history. It:
- Marks the last of the major extinctions of many animals, being rivalled only in intensity by the Permian extinction;
- Marks the end of tectonically driven sedimentation;
- Marks the beginning of the period when major tracts of land are submerged;
- Marks a quiet phase before mountain building.
Now compare these points with the Flood on or about day 150 as recorded in the Bible and note the similarities.3 On day 150:
- Every air-breathing creature not on the Ark is dead (Genesis 7:21);
- The fountains of the great deep and the windows of heaven (which could have been responsible for bringing sediments onto the surface of the earth through precipitation as pressures and temperatures of the ejected fluids fall) are in the process of being closed (Genesis 8:2);
- The Ark is free-floating over the oceans (Genesis 7:17) so there is no land whatsoever; and
- The mountains have not yet appeared from beneath the ocean but will do so in a matter of days (Genesis 8:4).
There are similarities between what the uniformitarian geologists are saying and what Genesis says. We now elaborate on each of these points before turning to specific aspects of the origin of chalk and its impact on point 3 to show that the agreement is really complete even on that point.
Extinctions
The focus on other periods of major extinctions in uniformitarian geology is unfortunate because of circular reasoning based on the geological column. The geological column is considered to be a robust concept whereby local correlations of fossils that were supposedly deposited in a relatively short geological time can be interleaved without compromise into a complete record of earth history across the whole world.
Once that exercise has been completed, typical geology texts tell us that many major extinctions occurred through the geological ages. The most severe extinctions occurred in the Permian, with others in the Ordovician, Devonian, Triassic, Jurassic (a minor one), and the last one being Cretaceous. Suggestions for the extinctions wax and wane, with little thought about how, if the climate or atmosphere is disturbed enough to cause extinctions, any form of life could continue.
At a symposium concerned with events at the K-T boundary (the Cretaceous extinction), Vogt and Holden (1979) described it thus:
Concerning the end-Cretaceous kill-off, we conclude that data can be dangerous. New data, regardless of reliability, have scarcely ruled out any of the past theories, but have fuelled . . . more outlandish proposals.
They then suggest ideas of their own, including “a late-Cretaceous Noahcean (sic) fleet, of which only one ark survived” and continue, “somehow, there are fields of science where the data become . . . harder as the theories . . . get softer.” Those are both interesting comments in a secular scientific document.
Kauffman (1979) in the same symposium made the following point:
It is doubtful that any single environmental change, no matter how severe, could have affected such a great ecologically diverse groups of organisms such that they become extinct.
The Bible makes it clear that one consequence of the Flood was that all air-breathing life was extinguished. A mechanism of mass deaths or mass killings, which is not the same as mass extinctions (Raup 1991), is therefore identified. Continuity of life was achieved by the preservation provided by the ark. So in principle, there is no difference between the two approaches. Admittedly we do not now have the rich variety of animals that existed in pre-Flood days (which might make us doubt that Noah took every kind of creature onto the ark and therefore denigrate the accuracy of the story), but their extinctions after they left the ark can be explained by uniformitarian processes (such as predation and hunting when there would have been only a small population base) occurring over the last 4,000–6,000 years.
In summary, the local extinctions in the “Cretaceous” deposits fit rather more convincingly into the framework of the Noachian Flood rather than a record of the last of four major extinction phases in life’s evolutionary history. Dorset and other localities that now possess thick chalk sequences simply contained the ecological niches in which some of the life-forms, subsequently labeled “Jurassic” and “Cretaceous,” lived in the days prior to the Flood. Their extinctions were due to the destructive phase completed in the first five months of that Flood. Otherwise we have to postulate that Dorset, for some unknown reason, only recorded in the rocks about 30% of earth’s supposed major historical periods since Precambrian times.4 It also missed other shorter periods of Tertiary history.5
Other major extinctions
As far as the combined Dorset/Hampshire Basin is concerned, where these huge thicknesses of chalk are present, the local rocks only represent a minute fraction of this supposed geological column. Cretaceous and Jurassic rocks are reasonably well represented.6 Beneath the “Jurassic” are sequences of rock that are defined as “Permo-Trias”—undifferentiated.7 Below that is basement. As a further point, there is an example in the chalk deposits that show that the geological column built in the way proposed ignores contradictions in the data, and we shall deal with an example from chalk in a later section. To that extent, these six uniformitarian periods of extinction (which are strictly “mass deaths”) are geologically related by a single process (the Flood) rather than separated by millions of years.
Although the statements of Vogt and Holden (1979), and Kauffman (1979) quoted above express turmoil amongst scientists in finding explanations for the K-T extinctions, the fact that there are five further periods of extinctions (if you accept the geological column) shows how little thought there has been given to the alternative biblical explanation.
Tectonic sedimentation
There is complete agreement on the point uniformitarian geologists are making regarding tectonic sedimentation and the Bible once the timescales are taken out of the discussion. However, there is an additional point in favour of the biblical record. Rarely in uniformitarian geology is paleo-reconstruction described. Without this the provenance of the sediments cannot be ascertained. The Bible, however, describes the fountains of the great deep as being active during the Flood, and to that extent, those mineral rich waters (coming from high temperature and pressure regions in the earth) would have supplied the essential sedimentary materials, either by precipitation as they emerged from the deep, or as carriers of slurries, or pulverized rock materials.
The amount of land submerged
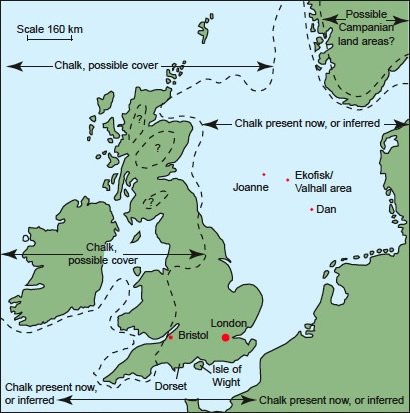
Fig. 2. Extent of submergence during Cretaceous times (after Rayner 1981).
The amount of land submerged during the Upper Cretaceous period is estimated on the basis of mapping the Upper Cretaceous chalk, mapping where there is evidence that it was once deposited and has since been eroded,8 and then extending those boundaries to account for the fact that if land were nearby, there would be sedimentary evidence of this within the chalks. There isn’t much land left, see for example Fig. 2, which is a composite map produced by Rayner (1981).
What is of interest in this mapping assumption is that the late Professor Jake Hancock, an expert on the “Cretaceous,” emphasized in his lectures how little land there was at the end of the “Cretaceous” period. This clearly puzzled his audience, though not this author. People commented on how wet and damp the world would have been. Geologists, if they have a phobia about answers in Genesis, have to postulate “some land” during the later “Cretaceous” period, because without it no air breathing creatures could have survived. It is circular reasoning.
Underlying this mapping of the Upper Cretaceous sediments is the assumption that the geological column allows us to recover snap-shots of the earth’s history at any particular point in time. For example, islands of land belonging to the Jurassic and older periods are identified in Fig. 2 on the basis that they were above sea-level whilst the Cretaceous chalks were being deposited under those warm seas. The author believes that this mapping is misleading, because it is based on the assumption that the construction of the geological column from what is often scrappy bits of local data allows rocks to be dated in a systematic way all over the world. However, if we first look more closely at the details and then consider certain specific aspects of “chalk,” then all objections to the declaration that “chalk,” and the bulk of the “Upper Cretaceous” are part of the Flood deposits disappear.
The quiet phase
Uniformitarian geologists see the Upper Cretaceous period as a quiet phase before mountain-building. They have 500 or more millions of years of major tectonic activity since the Precambrian, tectonic activity at an all-time low for possibly 60 million years, followed by even more aggressive tectonic and/or orogenic activity in respect of mountainbuilding during the Tertiary/Quaternary period (up to 60 million years). These different stages hardly justify the term uniformitarianism. If the present is the key to the past then the pre-Cretaceous earth processes should have continued during the Cretaceous, and on into the Tertiary/Quaternary.
What tumbles out of this supposed uniformitarian description of earth’s history is that there is a significant change in geological processes on earth during the “Cretaceous” period. Within the biblical record there is a significant difference between geological events up to day 150 (the fountains of the great deep and windows of heaven are operative) and after day 150 when the fountains of the great deep and windows of heaven are closed. To that extent the Bible had the answer first in Genesis for the change now noted by the uniformitarian geologists.
There is, of course, still opportunity for major amounts of precipitation (and hence sedimentation) to take place after the fountains of the great deep have closed because of the physical constraints that would have prevented waters from these deep sources undergoing instant mixing. Some of the post- Cretaceous sediments may be due to this mixing and precipitation, whilst other sediments may be reworking of Cretaceous and pre-Cretaceous sediments in what amounts to a Davisian rock cycle.
The Basic Premise of This Paper
We can now define a basic premise that we need to explore in greater detail—namely that the supposed Upper Cretaceous period corresponds in a limited way to a period approaching day 150 in the Noachian Flood. To that extent, the associated chalk is also a Flood deposit.
That does not mean that creationists agree on a single geological model of the Flood. Two major groups of models have been proposed. The traditional model came from Nelson (1931) and was further developed by Whitcomb and Morris (1961). They proposed that the majority of the fossil-bearing rock formations we currently see are the product of the Flood period and so are very visible. The second group of models are the cachetical (hidden) models as developed and explained by Tyler (1996), Garton (1996) and others. Bush (2008) provides a brief comparison of the two. We will discuss the details later alongside the issue of fossil orders.
Nor do key evangelical theologians accept the reality of a worldwide flood during the time of Noah. Kidner (1967) suggests that geology and archaeology are the only ways to understand the story of the Flood. His argument is that until secular geologists accept that the earth is young, and the Flood real in the way Whitcomb and Morris (1961) describe, he cannot recommend putting a grammatico-historical interpretation on the first few chapters of Genesis. This suggestion suffers from the problem noted above, namely if the bulk of geologists are theophobic, they have no interest in the Noachian Flood that judged the world.9 Even from the evangelical stable, other commentaries concentrate on the message of Genesis (Atkinson 1990), believing that it is possible to understand the spiritual message without subscribing to the historicity recorded in Genesis. This has created problems for the Christian church in its attitude to human sexuality (Matthews 2008a).
This approach by Kidner (1967) and Atkinson (1990) is as blinkered as Lyell. They, and he, are trying to explain earth’s geological history on the basis of processes that we observe today as being sufficient and necessary to explain rocks. A priori they have rejected the biblical story of the Flood as untenable without checking it out first.
Chalk
Chalk facies are dominantly found in the Upper Cretaceous (which is how “Cretaceous” gets its name). There are major deposits in the Danian which is now seen as part of the Tertiary, though from India there have been arguments that it should be part of the Cretaceous (Rao 1964). There are possibly even younger deposits. There are no modern analogues nor anything in strata older than Cretaceous (in a uniformitarian construction of geology).
The nature and location of chalk
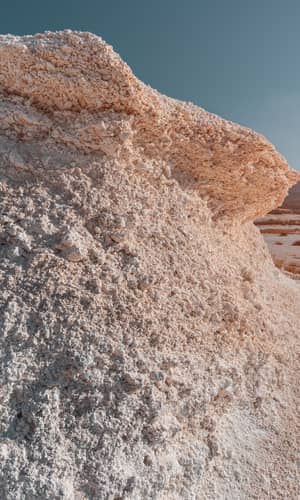
Regarding scenery, stark white chalk cliffs dominate many parts of the landscape from southwest England eastwards into Kent. The chalk passes under the English Channel and way into continental Europe. The edge of this chalk also stretches diagonally across the UK landscape from Dorset up into Yorkshire, see Fig. 1. The prevalence of chalk on either side of the English Channel means that it becomes the type section (Pettijohn 1975, p. 357). Thicknesses vary. In Dorset, 400 m is common (Bird 1995). In the Central Graben of the North Sea, the thickness exceed 1000 m (Megson 1992).
Whilst this paper will focus on the chalk in these regions, we have already noted chalk in Texas, India, Israel, and even thin stringers in Turkey (Hayward 1984)
Rawson (1992) provides us with the following description of chalk:
The typical chalk facies is a pure limestone of around 98% calcium carbonate with thin interbeds of marl or scattered nodules of flint. . . . The limestone consists essentially of detritus from calcareous algae, mainly in the form of simple, plate-like crystals but sometimes as coccoliths . . . or even complete coccospheres. . . . The coarser fraction (10–100 µm) include foraminifers, etc.
In a comment on fossil content, Rawson (1992) writes:
Unfortunately, the fossil zones are often poorly defined, index species may range far outside the zone and the range of species often has been calibrated against a lithological log, so that there is a great danger of circular arguments being applied in correlation. Furthermore, some of the zones have always proved unusable in the northern province chalk.
This is hardly an auspicious start for a uniformitarian geologist trying to explain chalk.
The origin of chalk
A uniformitarian viewpoint
Chalk, as a sedimentary rock, is not even mentioned in some books on the petrology of rocks, for example, Tucker (1981). Gallois and Edmunds (1965) explain the lack of a uniformitarian explanation for chalk thus:
Modern precipitated oozes such as those forming in the Bahama Banks are composed almost entirely of minute aragonite crystals with a negligible proportion of coccolith material and relatively little shell debris (in contrast to) ordinary white chalk (which consists of) a course fraction of shell debris and foraminifera embedded in a fine matrix of coccoliths . . . and their disintegration products.
The development of a whole range of hydrocarbon reservoirs in the North Sea has resulted in a wealth of new data about chalk being made available. There are several huge chalk reservoirs in the Norwegian sector such as Ekofisk and Valhall (for example, Kleppe 1987), some in the Danish sector such as Dan, and a single significant one in the U.K. (Joanne); see Fig. 2. They belong to the Danian (Doré and Vining 2005). What these new data have shown is that the problem of explaining the origin of chalk in 1965 is as acute today as it was in 1965. The biggest single factor is the realization that coccoliths do not settle.
Towards a young-earth creationist model
The chalk, where present, is almost at the top of the rock sequence, and it is, therefore, superficially tempting to identify it with the middle period (around day 150) of the Noachian Flood in line with the ideas of Whitcomb and Morris (1961) and the comments above about the Upper Cretaceous. This is not the only geological factor that makes a direct alignment of the time of the chalk deposition with the end of the Flood seem sensible, and some of these factors will be introduced later.
There are problems with this potential explanation. Since chalk is not a clastic rock, the coccoliths have to be obtained quickly and deposited all within a timescale of perhaps less than a few days if the ideas of Whitcomb and Morris, whereby the Flood left substantial visible evidence, are to be sustained. Snelling (1994) suggested a way in which this could have happened. However, Tyler (1996) attempted to show problems with Snelling’s paper, mentioning the possible slow maturity of the coccoliths, and the fact that European chalk appears to be due to a marine transgression rather than regression that might be expected at the end of the Flood.10
The remainder of this paper is about an explanation for the deposition of chalk within the timescale of a few days. Tyler’s objections to Snelling’s ideas are not challenged, but we show that factors not taken into account by Snelling or Tyler allow us to explain chalk deposition within a short period.
Explaining Chalk Deposition
Since chalk deposition is not observed today, we are entitled to propose a non-uniformitarian explanation that allows for the possibility that the four points, listed in an earlier section, occurred. There are two options for young-earth creationists to consider. The first is that the deposition of chalk can be explained as part of the Flood deposits in line with our discovery that the Upper Cretaceous bears similarity with circa day 150 of the Flood. The second is that the chalk is a post-Flood deposit (as proposed by Tyler).
Capturing coccoliths
One important discovery is that coccoliths (which make up the bulk of the chalk) are so small that they do not settle (Hancock 1983, and Hardman 1983). As an analogy, consider fog or mist. Fine droplets of water are suspended until they either evaporate, or collect more water (thus growing larger), and then, and only then, settle on the ground.
In still water coccoliths need 30 years to reach the bottom of sea bed 200 m down (Hancock 1983). Stokes’ law11 reminds us that the terminal velocity of a sphere falling through an undisturbed fluid decreases with size, and this gives us a physical understanding of what is happening.12 Minor convection currents, turbulence due to surface wind, movement of other marine life, dissolution, tides, and even being swallowed prevent the coccoliths reaching the bottom. So, the uniformitarian geologist is without a mechanism for sedimentation of chalk. This is freely admitted by Hancock, Rawson, Kennedy, and others. Similarly, Tyler’s model of post-Flood deposition also succumbs to the same problem, because he requires years of stable conditions to explain the growth and settlement of the coccoliths, which is difficult to explain in a transgressive environment where flow velocities may be many meters per second.
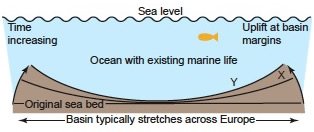
Fig. 3. A simple diagrammatic illustration of how coccoliths may be trapped.
To allow coccoliths to form a sediment, we have to move away from the concept of an open ocean environment where nothing is perfectly still and propose a dramatic alternative. The biblical story of the Noachian Flood provides a way forward. We need a closing ocean environment whereby existing coccoliths are trapped, and the remaining water drains away by Darcy flow13 through lower strata, see Fig. 3. The emergence of land after the destructive phase of the Flood provides the opportunity for this process. It may be compared to a cook using a kitchen colander to strain boiled vegetables. There are several supporting facts regarding the hydraulics and erosion of the emerging land which support the idea, and these issues will be discussed immediately below. It is important to note that Fig. 3 shows only one form of relative movement. There is no reason why, as an alternative, the central part of the sea bed should not sink while the extremities remain stationary. As further points, there can be a multiplicity of basins, and even minor basins that form within larger basins. There can also be temporary regressions and transgressions within parts of the basins.
Supporting details for the model
To justify this model of coccolith capture, we need supporting details. This will be given under eight headings with reference to the main chalk basin that begins in Dorset and stretches across the North Sea into Norwegian and Danish waters. Locations are shown in Fig. 4.
Chalk slumping
At the margins of the basins, as the chalk is drained, it will be temporarily perched on developing slopes, such as at position X in Fig. 3. Being more like a slurry than the present consolidated chalk, it will eventually slump, as the margins get steeper, into the deeper parts of individual basins to position Y. This is what is seen in the North Sea (Kennedy 1983), with retention of internal bedding and coherence from the time preceding the slumping.14
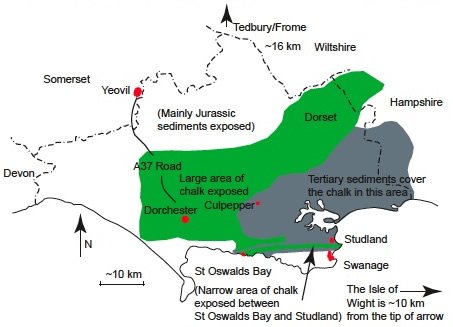
Fig. 4. Locations in the Dorset area mentioned in the text.
Monoclines
There is a possibility that the substantially folded edges of the chalk basins in the model proposed will subsequently be eroded and the evidence lost. However, particular examples which support this model of chalk capture do exist. The monocline stretching from Dorset and eastwards across the Isle of Wight provides one particular example of the warp at the basin edge that is part of this chalk model. The physical remnants of this particular monocline exceed 80 km (50 miles) in length, and there is indirect evidence for it having been longer.
This particular monocline is considered to be caused by a “Tertiary” movement, and therefore may not be acceptable as evidence supporting the chalk capture model offered. However, we have already flagged up reservations about the geological column which insists that Cretaceous and Tertiary periods are distinct. Specific evidence that the Cretaceous and Tertiary periods are potentially contemporary will be provided in a later section so that there are no problems with the model.
Smectite coating
In particular areas of the North Sea, the coccoliths are coated with smectite, a clay which cannot survive transport other than by short distances (Hancock 1983). This seems to add credence to the local and rapid trapping of the coccoliths. Drifting around for years (as per Tyler’s timescale) or millions of years (as uniformitarianism requires) would have destroyed the smectite. Also, the smectite had the potential to assist with flocculation.
Where did the smectite come from? As a result of tectonic fracturing of the basin as the margins lift, and possibly also in the centre, further volumes of mineral-rich magmatic water could have been released into the ocean at selected positions, and by precipitation coated the coccoliths. In terms of the timescale for the Flood, this would have happened up to the period of time when the fountains of the great deep were closed, namely, up to day 150 (see Genesis 8:2). Without discharges of mineral-rich waters from the fountains of the great deep there is no ready explanation for the smectite, since there was no localized place for the storage of the material from a previous geological event or “weathering” of a metamorphic high.
Flow at basin edges
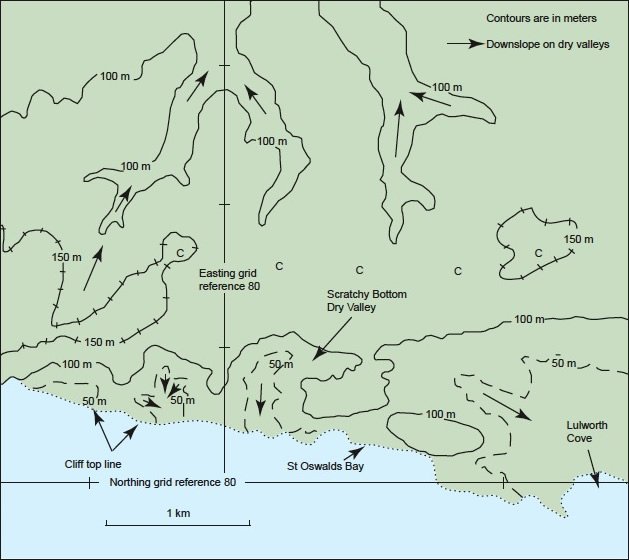
Fig. 5. Simplified contour map of coastal and nearby inland dry valleys.
Water must be drained from the basin so that the coccoliths compact. Almost certainly, as the edges of the basin lift, some ocean water will spill over the edges. Depending on the exact timing of the uplift a series of valleys will be formed. A simple contour map of several dry valleys in and near St. Oswalds Bay, Dorset, is shown in Fig. 5 which, as we shall show, appear to have been formed by this mechanism.
Two of the valleys point south (with their exits being seaward) and are attributable to flow out of the basin over a local rim. Others point north indicating flow into the basin as the warping occurred. Yet another valley points south-east. The series of Cs on the map indicate the line of a local high.
The fact that the valleys are in opposing directions (two main dendritic patterns to the north, two to the south and one to the south-east) rules out mechanisms such as jökulhlaup events.15 In this mechanism, we would expect the valleys to have a semi-radial pattern. We can also rule out permafrost and glaciation causes, since the glaciation is considered only to have come as far south as Bristol (100 km away). We will return to the topic again immediately below and the details of one of these south facing valleys one section later. This will reinforce our interpretation that these valleys were formed by a single denudation event, namely, the uplift of land as the Flood started to recede.
Flow within the basins
There is no reason why the warping that produced individual basins of chalk should have taken place at an even rate around the basin. Nor is there any reason to suppose that there was no warping within the basins. Under such conditions, sea water will have moved about within the basins at significant velocities.
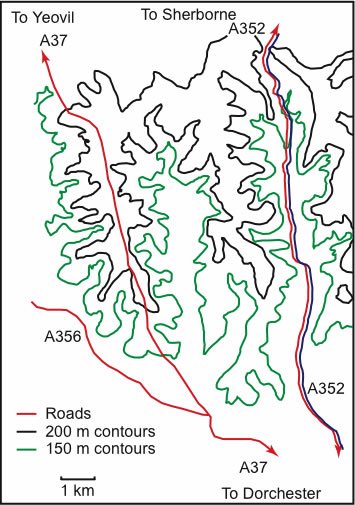
Fig. 6. Simplified contour map of mid-basin dry valleys.
A far more extensive set of opposing dry valleys can be seem on the trunk road (A37) between Dorchester and Yeovil (well away from the edge of this basin). The chalk has risen as a ridge which the modern road (based on the old Roman road) follows. Fig. 6 shows a simplified contour map. In the absence of cliffs and quarries, the internal structure of the chalk cannot readily be seen. These valleys, and many others in the area, often appear in opposing pairs pointing perpendicularly away from the line of uplift. They show a meandering nature typical of conventional rivers, but differ from such rivers in that the flow area of these dry valleys increases rapidly with distance from the head.
Their general morphology rules out formation by multiple processes. Rather, they are the product of a single drainage event as the Flood waters receded. Large volumes of water left the basin flowing first to the south, then turning east in a vast river which has been referred to as the “proto-Solent” (Goudie 1990). In the process the seaway between the mainland and the Isle of Wight was probably created.
The traditional explanations of ice damming and breaching (Bennett and Glasser 1996) do not work because of the limited area for storage of lake water, the need for the flow to disperse in opposing directions, and the dramatic channel widening. In reality, the ridging of the chalk has resulted in major bi-directional flow of sea water perpendicularly away from the ridge. The aggressive flow has scoured out the valleys which are now dry. There is a further point that rules out ice damming as the explanation in this region. The maximum excursion of ice sheets (and therefore the thermobars) is considered to be no further than Bristol (100 km to the north) (see fig. 2).
In contrast to the A37, the modern road (A352) winds its way north, closely following one of the minor rivers in Dorset (River Cerne) to its head. The river is not of a dendritic form. The valleys on either side of the road are dry. The river may be described as a “misfit” and provides further evidence of denudation dominated by a single staged regression.
Rate of lift of land
In a treatise on geomorphology, Thorne and Brunsden (1977) note that there is a problem with explaining the origin of valleys that contain relatively misfit (diminutive) rivers. Process (the explanation) does not tally with the form (the shape of the landscape). They therefore infer that rivers may well have discharged in the past at rates around 50 times those seen at present.
In examining the two main rivers of Dorset, a consideration of their hydraulic radii16 leads to an estimate that such valleys could only have been formed when the discharge rates were 50 times 50 of those at present. At 1,200–2,500 meters of rain per year needed to sustain those flow rates17 (that is, 3–6 meters per day) that would make life impossible. Thorne and Brunsden (1977) do not explain the details behind their estimate. Perhaps they were afraid of too many questions if they quoted higher rates, but of course, rates of times 50 are already pointing to the fact that uniformitarianism is creaking badly. In a single year in India (at Cheranpungee), 22 meters of rain fell in one year. In contrast, the highest consistent amount of annual precipitation was 11 meters in Mawsynram (over 38 years).
Now there is an alternative to considering a higher level of rainfall to explain misfit rivers and dry valleys. That is to note that the Flood ended with land rising from beneath the sea at high rates. The ark grounded on day 150 of the Flood. The tops of mountains were seen six weeks later, but around the ark, the water level does not appear to have dropped, at least for another two months. The ark is now assumed to be high in the Turkish mountains. This all points to a episodic rising of land from beneath the sea during the retreat of the Flood, and it is not unreasonable to postulate rates of 3 to 6 meters per day for limited periods of time in particular parts of the world.18 We now relate this discussion back to the chalk.
The Scratchy Bottom Dry Valley. One of the steepest dry valleys is near the monocline (see fig. 5) and is named “Scratchy Bottom.” Goudie and Brunsden (1997) have listed nineteen options that have been considered for its origin, but make no choice from that list. They wrote the following:
Could it be that the dry valley was formed by severe frost shattering and runoff (or) was the valley caused by a spring cutting back into the Chalk? . . . Scratchy Bottom is a perplexing but dramatic landform about which there are many unanswered questions. . . . It is worth considering in the field which of [the nineteen options] might explain the origin.
One wonders why these experts cannot answer their own question. The truth has to be that it was rapid uplift of land, which is not acceptable to uniformitarianism. There are four things that point to this explanation:
- The absence of a uniformitarian explanation;
- The enlarging flow area from head to exit which can accommodate the required discharge rates equivalent to a lowering of the overland water depth by 1–10 meters per day;
- The presence of detritus; and
- The shape of the detritus.
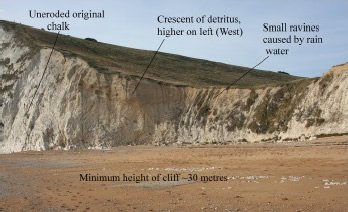
Fig. 7. The cross-section of the Scratchy Bottom Dry Valley exposed in the cliff.
Fig. 7 shows the crescent of detritus (the darker material). Its origin and shape may be explained thus. When the scouring out of the valley took place, chalk particles will have been suspended as a load by the turbulence. Winnowing will also have taken place, with the smaller particles being much more readily lifted into the main flow, and carried away. (Think of the classical Hjüllstrom diagram19). Since the flow could not have been sustained for long, local velocities will have fallen rapidly, and the larger particles will have settled on the valley bottom more readily than the smaller particles.
The crescent of detritus is higher on the west side than the east by several metres. Now the valley has a perpendicular bend to the east just inland (see fig. 5). Water that poured down the valley will therefore have flowed at a faster rate on the west side (the outside of the bend) than the east and created a concave water surface. The crescent of detritus will therefore be higher on the west side. The height difference is several metres, which points to the western flow rate having been perhaps 6 meters per second faster than on the east side.20 That was no ordinary river.
Groundwater flow
Seawater will also have left the emerging basins by groundwater flow where basins were lifted above the local sea level. Also note that at day 150 the Flood period regression must have started in many parts of the world (though in other parts, to conserve the total volume of water the depth of the sea must have increased). Thus there is no reason in principle why the sea level will be falling around some of the chalk basins at this point in time.
Flow of water downwards through the chalk as parts of the basin lift, because it is passing through recently sedimented chalk which is not fully consolidated, would have carried fines away downwards, creating voids which were then filled with a variety of “younger” material. These voids will have exacerbated the flow paths, thus preferentially enlarging the voids. Dish structures will have formed, as will drainage pipes.
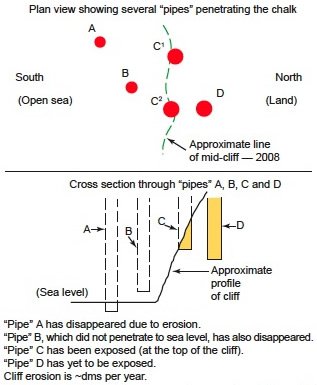
Fig. 8. Illustrating how progressive erosion of the cliff reveals different pipes (or funnels).
Dish structures. There are many dish structures in the Dorset and Hampshire areas. The highest concentration is in the west (100/km2, Goudie 1990), whilst away from the margins of the basin the concentration drops to around 0.1/km2. This is, of course, consistent with the hypothesis for basin formation shown in Fig. 3, because the major uplift (and hence the greater propensity for groundwater flow) was at the margins.
House (1989) describes the largest of the dish structures at Culpepper.21 Around 100,000 tonnes of sediment have disappeared downwards into what is called a “solution cavern” below.22 There are three points that cast doubt on the proposed mechanism of formation whereby rainwater has reacted with the chalk to form a soluble compound which is then removed by groundwater flow. Vardiman, Snelling and Chaffin (2005) deny us much time. The area is a topographical high which would therefore direct post- Cretaceous rainwater away from it. There is another dish the other side of a narrow road, but no others for miles.
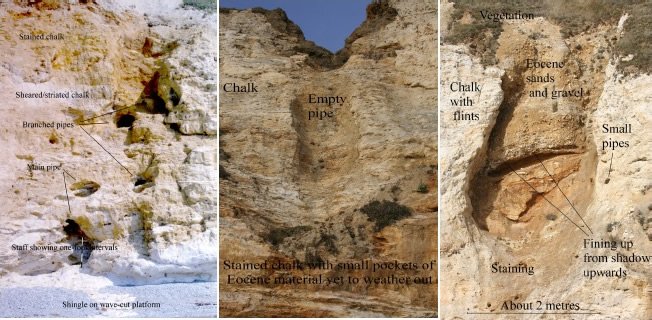
“Pipes.” The chalk cliff in St. Oswalds Bay is stained in places with red and/or brown material. Individual patches of this material then disappear due to erosion, only to be replaced later by staining appearing elsewhere. Arkell (1947) was the first to note these progressive changes to the cliff. House (1985 and 1995) has also documented the process, and the author has been observing the cliffs since 1990. House organized abseiling trips down the cliff to recover samples of the non-chalk material. He claimed that it was Eocene. Fig. 8 shows a schematic of the progressive revelation of this feature that appears to be unique to the St. Oswalds Bay part of Dorset based on recent photographs in Fig. 9 and documented history of the Bay.
The upper part of Fig. 8 shows a conceptual plan of a series of “pipes” that are full of Eocene material but penetrate the chalk to varying depths. (Note: the locations are conceptual, not absolute.) They are approximately circular, and diameters vary from decimeters to several meters. Some of the “pipes” bifurcate. They cannot be readily seen in the pasture land at the top of the cliff because of the accumulation of top-soils.
The upper portion of the figure shows that “pipes” A and B have been lost due to cliff retreat. For example, “pipe” A may be considered to have been “The Red Funnel” documented by Arkell (1947). Arkell considered that it penetrated below sea level, as shown in the lower part of the diagram. Not knowing exactly where the Funnel was, and the fact that the beach is covered with shingle, prevents a re-exploration of it. A “pipe” that was later exposed is shown in Fig. 9a, and is a bifurcated “pipe” photographed by the author in 1999. The Eocene fill has been washed out of the “pipes” and stained the chalk. In summer 2007 the “pipe” was still much as shown in the photograph (fig. 9a). However, the whole profile of this feature was lost during the winter of 2007/2008 due to erosion. These two may be thought of as having been equivalent to “pipes” A and B in the figure.
The upper portion of Fig. 8 shows two “pipes” in approximate east-west alignment designed to explain Figs. 9b and 9c. Fig. 9b shows an empty “pipe” exposed at the top of the cliff which only penetrated a small fraction of the way into the chalk. This is represented schematically by “pipe” C1. In the cross-section, “pipe” C represents both C1 and C2. The Eocene material that was present in the yellow area (in the crosssection) has been washed away. Fig. 9c shows a “pipe” reaching almost to beach level and still containing brown Eocene material. In our schematic diagram, this is represented by “pipe” C2. However, the Eocene fill that was originally present in the yellow area has not yet been washed away. What is particularly of interest is the fact that part of the fill is banded. If Eocene material had slumped slowly into the “pipe” as it developed over millions of years we might have expected a jumbled mass of sediment. Instead, the banding suggests that the formation of the “pipe” was rapid, and the entry of the material and its settlement controlled by Stokes’ law which allows the larger sized material to fall faster in this watery environment.
Click to enlarge
Fig. 9. Photographs of three different “pipes” at St. Oswalds Bay, 1999.
A further comment is appropriate about the rate of erosion of the cliff. Various geologists have noted that the retreat typically exceeds a decimeter per year (though it is episodic, as the explanation for fig. 9 shows). With the stubs of the Jurassic rock only 200 meters offshore, the cliffs have completed their retreat to their present position in 2,000 years, not millions.
Our physical description of the “pipes” leads us to offer the following holistic explanation of their origin consistent with our hypothesis that the events happened around day 150 in the Flood:
- The folded chalk (with dips of 70º to 90º north) lifted rapidly while much of the chalk was still unconsolidated;
- Water draining downwards by Darcy flow carried away substantial amounts of chalk fragments (fines) thereby enlarging the passageways into wide “pipes” as it did so; and
- The overlying sediments slumped rapidly into the “pipes.”
Since then the “pipes” have been progressively revealed and lost by erosion in the cliff. How many more “pipes” remain hidden (such as D) is an open question that only time can answer.
The presence of hydrocarbons
Oil and gas are found in chalk reservoirs. In a discussion of the origin of these hydrocarbons, Matthews (2008b) makes the point that the only realistic explanation for their origin is the direct creation by God in Creation Week, thus making the oil “theobaric.” Furthermore, the emplacement of the hydrocarbons in the chalk reservoirs means that the fountains of the great deep were still active during the time the chalk was being deposited. This is therefore supplementary evidence that the chalk deposits formed during the one-year Flood period.
There are four geological points that support this inference in addition to the points elaborated by Matthews (2008b) on the specific origin of oil:
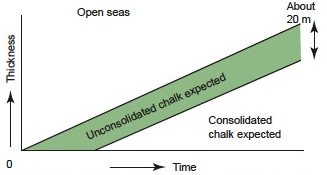
Fig. 10. Showing where pressure diagenesis occurs in a growing column of chalk.
Diagenesis. Diagenesis is a chemical change to rock after sedimentation has occurred, and can take place in one of two ways. Burial of the chalk beyond a certain depth results in pressure on the coccoliths so that they start to weld themselves together. This is mechanical or pressure diagenesis (see fig. 10). As the column of chalk increases in thickness beyond about 20 m (Hardman 1983), the bottom part of the chalk will consolidate through pressure diagenesis.
The other type of diagenesis is solution (or chemical), whereby a change in pressure or temperature of the pore water (because it will be charged with calcium carbonate) results in precipitation of carbonate onto the coccoliths and so cements them together. Obviously the carbonate solution has to come from somewhere, and this could include material solubilized from other coccoliths.
Mechanical diagenesis will not occur if the burial is shallow or if the overburden is supported (even in a limited form) by excessive fluid pressure. If there is an emplacement of a hydraulically tight layer of sediment before the coccoliths are naturally compacted, such over-pressures will form. There will then be no mechanical diagenesis, but chemical diagenesis could still occur. The removal of water from the pore space, and its replacement with oil or gas will prevent chemical diagenesis, because carbonate is relatively insoluble in hydrocarbons (Bjørlykke et al 1992). However, noting that the density of oil is typically 80% that of water, the oil will always be located in the higher structural positions of the reservoir. Hence it cannot stop the diagenesis throughout the whole column of the chalk on its own. The lack of diagenesis at the base of a chalk reservoir, which is deeper than 20 m,23 is indicative of rapid deposition.
Fluid pressures. Significant overpressures in the pore fluids are seen in many chalk reservoirs, including Ekofisk and Valhall (Norway). Although suggestions that the over-pressures are caused by non-catastrophic mechanisms such as fluid expansion (as organic matter supposedly turns into hydrocarbons), clay rehydration and aquathermal pressuring, Vejbæk (2008) rules these out at least for the Danish reservoirs on the basis that the only reasonable mechanism is disequilibrium compaction associated with accelerated deposition—which is, of course, the mechanism we are offering to explain the origin of chalk deposits.
In the Norwegian reservoirs, the overburden24 is supported by the high fluid pressures rather than the rock. The chalks are not consolidated and so diagenesis has not taken place. The pressures are over 470 bars (around 7,150 psi, see Sulak, Nossa and Thompson 1990), whereas a normal pressure25 would be 300 bars (about 4,500 psi) for these depths.
The fact that over-pressures have been maintained through what is considered to be tens of millions of years has puzzled scientists (Muggeridge et al 2005). They note that in many situations the permeability is too high and/or the thickness of the cap rocks too low to sustain the over-pressures for more than 10,000 years.26 Whilst Muggeridge et al (2005) have concluded that there are circumstances where the over-pressures could have been sustained in basins rather than individual reservoirs, there is no discussion of whether the detailed geology of these basins corresponds to their mathematical models. Factors which would make the pressures fall faster than they calculate include:
- Leakage through the sides of the reservoir;
- Microfracturing during “geological time” which will enhance permeability of the cap rock (consider the gas-chimney over Ekofisk as an example of the problems of containing the over-pressures); and
- The fact that oil entered reservoirs when they were at shallow depth (Wilson 2005) means that the cap rocks were thin and at a higher permeability through lack of pressure consolidation. Overpressures could easily have been dissipated then.27
Hydraulic isolation. To achieve the high fluid pressures requires the arrival of the cap rock material, capable of providing a hydraulic seal, prior to the settlement of the chalk particles. Now, because there has been no contact diagenesis at the bottom of the chalk sequence, the whole column of chalk (rather than just the top parts) had not fully settled by the time the cap rock was in place. This requires a very short space of time, perhaps hours rather than years.28 A further point to note is that in order to retain the excess pressure, not only must the cap rock have been emplaced within hours, but an additional overburden of perhaps ~650 m (2,200 feet) of rock must have been emplaced29 to prevent hydraulic fracturing of that same cap rock. So not only must the chalk have been deposited in a matter of hours, but significant thicknesses of overburden must have arrived soon after.
Table 1. Details of Ekofisk Reservoir chalks.
| Name of Formation | Source of Chalk | Porosity/degree of Diagenesis | Age and Thickness |
|---|---|---|---|
| Ekofisk U | Autochthonous (formed at that location) | Low/ high | Danian 100–150 m |
| Ekofisk M | Allochthonous (from outside) | High/low | |
| Ekofisk L | Allochthonous (Maastrichtian) | High/low | |
| Tight Layer | (Argillaceous material) | None | Faulted out in center of reservoir |
| Tor U | Allochthonous | High/low | Maastrichtian 15–80 m |
| Tor M | Allochthonous | Medium/medium | |
| Tor L | ? (cemented) | Low/ high | |
| Hod | ? | Useless, though not in other reservoirs |
Breaching of cap rock. Over the Ekofisk reservoir, there is a gas chimney (Kleppe 1987) showing that the cap rock was fractured at one point in time. A similar situation exists in U.K. Block 30/19 (Cayley 1987). Neither chimney reaches the surface.30 The implications are that, although the cap rock seals may have been slow to form, there were rapid deposits of additional overburden material compared with the timescales in the footnote.
Example details from Ekofisk. Table 1 shows data on the chalk of the Ekofisk reservoir; see Fritsen and Corrigan (1990). In the 1990s, the Ekofisk production platform started to sink, because as hydrocarbons were produced from the reservoir, the coccolith structure collapsed, and the collapse was transmitted up to the sea bed. The platform was later jacked up.
Note the high porosity (implying virtually no consolidation of the chalk) in the Lower Ekofisk, and the Upper Tor, formations even at depths greater than 20 m. The tight argillaceous layer separating Ekofisk and Tor is faulted out in the centre of the reservoir, and hence there is a single oil column.
Implications for Flood models
The fact that coccoliths do not settle naturally, and that diagenesis does not always occur in deep chalk, rules out a uniformitarian model of deposition. It similarly rules out a post-Flood deposition, except of timescales that are reminiscent of the Flood. We are left with the only reasonable choice that the thick chalk sequences seen in the strata were produced around the end of the phase when activity changed from open fountains of the great deep to closed fountains of the great deep during the Noachian Flood.
Admittedly, this raises other questions. Why do the fossils show some semblance of being ordered; what caused the warping at the basin edges; where did the coccoliths come from; why are there hardgrounds within the chalk; and what do they mean for the timescale estimates?
Some of these questions can be answered explicitly, whilst others cannot. Some can be answered from geology, such as the ordering of the fossils (see below). Others have to be answered from the historical record in the Bible, while others can only be answered implicitly through decision-making processes. Each of these will now be addressed.
Dealing with Uniformitarian Geological Questions
Objections from uniformitarian geologists to the model of chalk formation in this paper may focus on one of three key issues. First will be about the age of the rocks. This is dealt with adequately by Vardiman, Snelling, and Chaffin (2005), although that work is insufficient to confirm the deposits of the chalk and the hardgrounds occurred within a matter of hours to years depending on the choice of Flood model. The second is that evolution (on which the geological column is based) is supported by biology. Denton (1986), who is not a creationist, shows the paucity of this argument. Finally there is the question of the geological column. Support from a uniformitarian interpretation of the supposed rock sequences comes from a supposed common ordering of fossils.
We deal with supposed common ordering of fossils, before turning our attention to the wider issues of the geological column.
The common ordering of fossils
There are three ways of explaining the order of fossils. In uniformitarian geology, the fossil order is considered to indicate evolution.
Young-earth creationists have proposed two other alternatives. There is the traditional one promoted by Whitcomb and Morris (1961) whereby the bulk of the fossil-bearing rocks are a visible testimony to the Noachian Flood, and the fossils were entombed during that Flood. At the other extreme is where the Flood is assumed to have left no visible record (and is therefore cachetical—hidden). Fossil entombing is therefore a product of post-Flood activity. There are several intermediate variants, placing the Flood/ post-Flood boundary at different positions within the geological column, and a brief discussion is given by Bowden (1998).
Explaining the order of the fossils in any of the post- Flood (cachetical) models is difficult. The suggestion has been made that fossil order is due to a progressive movement (recolonization) of species away from the landing site of the ark. This, of course, only explains the fossil order of terrestrial creatures and not aquatic creatures, since these were already dispersed in the ocean at the end of the Flood. The theological aspects of this have been dealt with by Matthews (2008b) in a companion paper on the origin of oil and gas. A structured review of cachetical and visible-evidence models in the context of chalk will be given below.
Innocuous statements are sometimes made (by uniformitarians) about fossils that can easily be read as meaning more than the particular author can justify. Consider the comment by Insole, Daly and Gale (1999), namely:
Cretaceous deposits . . . [contain] the same fossils . . . across Europe, and into western Asia, as far east as Kazakhstan, on the eastern shores of the Caspian Sea, and also as far afield as Texas and Western Australia.
The authors have not said that the order within the sediments is identical. Nevertheless, we have to acknowledge that there is some semblance of order within the deposits (as documented by Arkell 1947) and certainly a degree of similarity between the fossils found in the chalks when compared with fossils found in rocks older than the chalk, but the comparisons are not exact (Mortimore, Woods and Gallois 2001) and may sometimes be confusing (see the earlier quote by Rawson 1992).
The suggestion given above of how the chalk deposits were formed does allow us to provide some explanation as to how a limited amount of fossil ordering can be preserved without appealing to evolution, recolonization or the issue of hydrodynamic drag on live and dead creatures within rapidly moving Flood waters.31 Note the following points of alignment between geological observation and the Flood model proposed:
-
There are no fossils of terrestrial creatures within the chalk.
Assuming that the chalk was deposited during the Flood period of one year, then the reason for their absence in the chalk is that the surface of the earth was, at this stage around day 150, completely covered by the Flood waters. If one of the cachetical/Recolonization models were a better explanation we would expect to find some evidence of terrestrial life (or even land-derived sediment within all parts of the chalk) because the ark had grounded, the Noachian family and the animals had disembarked and resumed normal life for possibly hundreds of years, and rivers were discharging sediment into the seas. Remember, God promised not to flood the earth again (Genesis 9:11), so another worldwide flood is not an optional explanation. Tectonic activity is assumed to have declined in the cachetical/Recolonization models, rather than saving itself for one great final fling—mountain-building which normally is considered to be a post-Cretaceous phenomenon.
-
Fauna (modern and Cretaceous) can be stratified even within the column of water they inhabit (Hart 1983).
There are a range of shallow (bathyal), intermediate and deep water (abyssal) specimens. The depths that individual creatures inhabit are driven by light availability, water temperature, salinity gradients, and possible types of food supply. Thus, if the floor of the ocean comes up to meet them and trap them, then there will be some semblance of fossil order over large areas of what was ocean as the sea bed collects the abyssal creatures (like a giant colander) before sequentially collecting those creatures living at intermediate and then shallower depths.
If there were exact correspondence of fossils, nonchalk layers, etc across all the chalk basins, it may be difficult to justify the model described. But that is not the case, as Mortimore, Woods and Gallois (2001) show. They note:
- A major difference in fossils between the Boreal (northern province) and Tethyan (southern) Realms of the Upper Cretaceous (many ammonites, unicells and foraminifera are absent in the Boreal (p. 617));
- The different flint styles, colors and stratigraphical issues within the chalk (p. 15+);
- A thick marl in the southern province which is not developed in the northern province; and
- Paleomagnetic reversals (p. 25) suggested in the Campanian break down over major tectonic structures.
We conclude that there is enough evidence from the fossil content of different areas of chalk to confirm that their deposition occurred around day 150 in the Noachian Flood. There is, however, some geographical variation due to different ecological niches and proximity to different discharge points of the fountains of the great deep.
Hardgrounds
Hardgrounds32 are seen at several levels within the Cretaceous chalk (Mortimore, Woods and Gallois 2001) and the (Ekofisk) Palaeocene chalk (Kleppe 1987). At the particular positions, the chalk is harder, and there are usually preserved burrows. Colonization of the hardground by the burrowing creatures is considered to take years (Wilson and Palmer 1992). Woodmorappe (2006) has considered the general aspects of hardgrounds in the context of the biblical Flood and noted many problems with the uniformitarian explanations. However, he says little about chalk hardgrounds.
Chalk will not naturally form a hardground without diagenetic cement being deposited. Pressure diagenesis has been ruled out above, because there has to be at least 20 m of sediment above to provide the pressure, and so the surface of the chalk cannot then be at the sea bottom if this is the mechanism of hardground formation. Neither can it have seabottom creatures making their homes there.
Solution diagenesis can only occur if there is a influx of mineral-rich water which, because of change of temperature, pressure or pH, precipitates a cement. This does suggest that we are still in the period of the biblical Flood, while the fountains of the great deep are still active and are discharging episodically because of hydraulic constraints.33 This appears to be the only way in which it is possible to explain large quantities of mineral-rich water, especially that are capable of converting calcium carbonate limestone into the magnesium-calcium carbonate dolomite. See the discussion on hardgrounds and carbonate chemistry in Krauskopf and Bird (1995).
Obviously, detailed explanations for individual hardgrounds cannot be provided without further specific study. However, we may make an analogy with Tedbury, which reminds us of our fallibility in matters of geology. Individual occurrences of hardgrounds within the chalk will need further study, but a methodology has been identified based on the supposed Tedbury “hardground” which may allow all other chalk problems to be solved satisfactorily.
The limestone plateau at Tedbury, near Frome, was considered to be one such example of a hardground requiring perhaps thirty years to form in a post-Flood environment (Garton, pers. comm.). Visits to the site by this author have shown that there are at least three separate indicators that the limestone formation which was classed as a hardground (Duff, McKirdy and Hartley 1984) remained a soft sediment until after the upper layers were deposited on the limestone. So the limestone was not hard when the creatures in the limestone were active.
Wilson and Palmer (1992) make interesting comments about hardgrounds which provide general support for this interpretation of Tedbury. They note:
- Hardgrounds are areally extensive (for example 104 km2) compared with the supposed “analogies” identified in order to apply uniformitarianism. This would suggest that a lot of guesswork is being applied to understand hardgrounds and there is therefore a big risk of getting it wrong;
- Hardgrounds are thin, suggesting some form of hiatus. We suggest that this is a limited tectonic event which releases a quantity of hydrothermal water, and is part of the biblical Flood period when the fountains of the great deep were active;
- That hardgrounds include soft-creature burrows. This at least shows that the sediments were soft for a short period of time, in keeping with the model of chalk formation suggested;
- The hardened tubes of the burrows extend down into the soft sediments beneath. This also supports the principle that the cements arrived after burrows had been made; and
- The burrows are often mineral stained. This shows that certain cements arrived after the burrows were made.
Wilson and Palmer (1992) also mention that early calcite veins are cut by animal borings. This would initially suggest that the rock was hardened before the burrows were made. However, an alternative explanation is possible whereby the borings are made in soft sediment and then tectonic events release carbonate-rich waters from below which part the soft sediment in a fracture-like mode. Within the fractures the carbonate precipitates, but if the creatures are still in their burrows, the fracturing will not propagate across the creatures. Assuming that the calcite arrived before the creatures had decomposed significantly, they will have had the potential to retain enough bodily elasticity to distort slightly, and thus allow the calcite-rich waters to pass around them. On the basis of standard “cross-cutting” relationships, it will now look as if the burrows came after the calcite veins, but the opposite is true. Rock samples showing this behavior have been recovered by the author from Tedbury.
In summary, hardgrounds do not cause significant problems for the hypothesis that chalk is a product of the Flood period.
The Geological Column
The geological column is sacrosanct in geology. It is true that it does sometimes help in the mining industry by allowing beds to be traced over short distances. However, we now give a very specific example from the chalk that shows that the geological column is a correlation,34 and that therefore strict allegiance to it can be totally misleading when it is used to interpret earth’s history.
The Ballard Down Unconformity
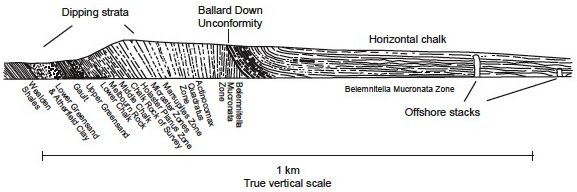
Fig. 11. The Ballard Down Unconformity from the east (after Arkell 1947).
In Ballard Down, between Swanage and Studland (fig. 4), chalk cliffs are exposed from sea level to cliff top (50 to 100 m). To the south, older rocks labelled “Lower Cretaceous and Jurassic” are dipping at between 70º to 90º to the north. To the north of Ballard Down, the chalk (labelled “Campanian”) is almost horizontal. The place in the middle where these two different angles meet was first judged around 180035 to be an unconformity. Admittedly the interface is curvilinear, and shown in Fig 11.
In later years, the geological column was being developed on the basis of a common ordering of fossils which was assumed to be valid worldwide. A conundrum then arose. The strata to the south, because they dip north in a movement that was deemed to have happened in Tertiary times, cannot form an unconformity in Cretaceous sediments. Rather than revise the understanding of the geological column, geologists then went to work to explain the “unconformity” as a thrust fault of some form. In 1822, a southern overthrust was put forward as the explanation, but by 1837 a northern underthrust was suggested because of problems with the former model.36
Various other attempts have been made over the intervening years to refine the models, but none have succeeded in explaining the evidence in the rocks. In the last few years, a PhD student at Imperial College (London) revisited the problem whilst studying the distribution of fractures at Ballard Down. With his supervisor, they re-iterated the view that a northern overthrust is the answer to its origin (Ameen and Cosgrove 1990). Within a short period of time, Carter (1991) had pointed out other objections to the model of Ameen and Cosgrove, and offered yet another model. A counter-critique of this was then written by Ameen and Cosgrove (1991), and resolution of the matter therefore awaited sampling to determine ages of the fossils37 and seismic data.
When the seismic data became available, Underhill and Paterson (1998) offered the view that the Ameen and Cosgrove (1990) proposal was inconsistent with the new data though consistent with the Carter (1991) proposal. They therefore recommended the Carter model (although strictly it had its origin in 1822), because they only have two options to chose from. There is no discussion of Ameen and Cosgrove’s objections to the Carter model or of the fact that both models require thick deposits of chalk to have existed to the south (beyond the monocline) without a thought to how the chalk was deposited. We are left with a complex statement that the Ballard Down Fault is “a local, late-stage ‘out-of-syncline’ reverse fault which propagated southwards and upwards through a chalk succession.” Is this sentence a “complete triumph of terminology over common sense and facts” quoted by Lerche (1990) as a common problem with stratigraphy?
Probing deeper into the problem of Ballard Down, we see a hidden assumption in all of these studies from 1822 onwards, namely that a Tertiary sediment and tectonic activity cannot happen when Cretaceous sediments are being deposited at the same time, and vice versa. So we either admit major failings with the concept of the geological column (which is an Occam’s razor solution to the problem) or continue to argue whether the “conundrum in the rocks” is a southern overthrust or a northern underthrust.
In light of the comments about the lack of more than a trivial amount of the supposed geological column being present in the area, and the comment about Ballard Down, we can blur parts of the geological column from one area to another, or even reject it entirely. Thus the geological column needs to be used cautiously in Flood geology models, and may be completely misleading.
The map of “Upper Cretaceous” landscape
In an earlier section we did not complete our discussion of the extent of land during the “Upper Cretaceous” period. Jurassic and older islands were shown on Fig. 2. Because our discussion about Ballard Down shows that at a minimum, adjacent parts of the geological column are not necessarily products of different periods of time, we cannot argue that the “Jurassic” and other older islands (which are not aeolian sediments) were not below sea level when the “Upper Cretaceous” chalks were being captured. Going back to Fig. 2, the “Jurassic” sediments were simply outside the chalk basins, were beneath sea level, and stayed that way possibly for a period of several days. The fact that Jurassic sediments (and those supposedly deeper in the geological column) possess dry valleys shows the rapidity of the emergence of land consistent with day 150 onwards in the biblical record of the Flood.
Other Issues
This section is a miscellaneous collection of points that may be important in any discussion on the thesis of this paper.
The ages of the rocks
Vardiman, Snelling, and Chaffin (2005) have shown that radiometric dating has seriously over-estimated the ages of the rocks. In parts of our discussion we have used this as a fact in order to develop our model of chalk formation. Nevertheless, there have been a number of factors observed that point to very short timescales for earth’s history from “Upper Cretaceous” to present. In particular, the discussion about the geological column has shown that the age of “Upper Cretaceous” sediments has potentially been over-dated relative to Tertiary sediments by 10 to 35 million years. Even more startling is the fact that the oil reservoirs in the chalk of the North Sea cannot be older than 10,000 years based on their overpressures.
Warping
The geological processes that caused the warping at the basin edges cannot be explained by reference to underlying geological mechanisms. However, it is an observational fact, based on structural interpretations, that such warping has occurred penecontemporaneously with the deposition of the chalk. The Ballard Down Unconformity is an example of this. So in principle, there is no problem with explaining the warping if we believe that chalk is a within-Flood deposit compared with the other options.
Origin of coccoliths
A typical view of the coccolith population is that they occupy depths of 60–100 m (Pettijohn 1975, p. 379). No formal identification of the origin of the coccoliths that undergo trapping as shown in Fig. 3 is possible. However, there had been almost 2,000 years of earth’s history prior to the Flood during which the coccolith population originally created by God could have expanded to provide the required volume. Remember that there is no opportunity for them to settle either before the Flood, or during the early phases of the Flood. So in principle, there is no problem with the coccolith supply.
Circular arguments
The objection could be made that the paper began by assuming that the geological column was a robust concept, and that allowed a comparison to be made between the Upper Cretaceous period and the biblical description of the period around day 150 of the Flood. By later showing that the Upper Cretaceous and Tertiary were potentially time equivalents invalidates (as a minimum) parts of the geological column. Therefore, the premise on which the paper begun is no longer tenable.
Those who make this counter-argument must recognize the following. All the material in this paper has respected Steno’s law of deposition. Unless there is clear evidence that folding and overturning has occurred, the visible order of the rocks is the order in which they were deposited. While research continues to understand the rock mechanics issues behind large-scale overthrusting (such that the order of the biofacies within the visible rock column is not that of the geological column) no robust explanations have been obtained for the phenomenon (Briegel and Xiao 2001). The research only continues because of the a priori assumption that the original depositional order was that of the geological column. None of the inferences in this paper rely on anything other than the visible order of the rocks.
En passant, we need to note that the effect of the work of Briegel and Xiao (and their references) is to challenge more than a small portion of the geological column. They specifically mention the Glarus38 and Moine39 “overthrusts,” which unless the rock mechanics of overthrusting can be explained, riddle the geological column with further contradictions. The topic clearly needs a further paper dedicated to the topic.
Summary—Coming to a Conclusion
In the polite world of geoscientific research, people can continue to discuss the relative merits of the models of northern underthrust and southern overthrust for explaining Ballard Down and continue to research how rock mechanics is compatible with the assumption that large-scale décollement and sliding supposedly occurred. But there are a bigger issues at stake:
- Is the chalk at Ballard Down telling us that the geological column is of dubious value for unravelling earth’s history, and at worst totally misleading?
- Is chalk as a whole part of the Flood period?
- Are the “Upper Cretaceous” sediments confirmation of the Flood?
- Are the extinctions in the “Upper Cretaceous” caused by the Flood?
Decision-making
In an ideal world, we would like all evidence to point clearly in the same direction, but that ideal will never occur. For example, whilst we have shown that the Cretaceous and Tertiary periods were possibly contemporaneous in certain geographical areas (rather than being separated by millions of years), we have not yet attempted to demonstrate that every part of the geological column was contemporaneous with some other part of the geological column. In areas of everyday life, and in industrial situations where investment plans have to be made, since these decisions have to be made in the absence of full understanding, human beings will adopt a process of looking for something “good enough” (Miller 1974) in order to move forward with their lives and businesses. Keen and Morton (1978) call the process “satisficing.” Most of us come to Christ in the same way. He is seen as having key answers to life, but not everything is clear. From a human point of view there are always those nagging doubts which we live with. We see through a glass darkly, as the words of Paul in 1 Corinthians 13:12 are translated in the King James (Authorized) Version.40 Personal devotion and evangelism would cease if doubts controlled us. Now faith is being sure . . . of what we do not see (Hebrews 11:1), and surely that must apply to our view of geology, as well as our view of eternity.
Bringing matters to a head. When we have serious doubts, we are entitled to put out a “fleece” as did Gideon (Judges 6:37). In fact, we can do it twice (verse 39). God also tells Ahaz (Isaiah 7:11) to ask for a sign. Where the whole process can go horribly wrong is when we have the signs, but want more than God is prepared to give us. Jesus effectively said “enough is enough” to the Pharisees (Matthew 12:38++) when they wanted a miraculous sign. Herod had a similar hope for another sign (Luke 23:8), but Jesus did nothing. Similarly, secular studies on decision-making show (for example, Lee 1997 and Sivia 1996) that agreement on what will trigger the decision one way or the other must be made earlier in the search for relevant data and not constantly be postponed. Otherwise, the decision-making process degenerates into farce, with one or the other side claiming that there is a bit more evidence just around the corner which will finally clinch their preferred choice.
The MUA system. To show how this decisionmaking works, consider the choice between a geological model of the Flood which leaves little or no geological evidence in the rocks with a model that leaves substantial evidence. We will use the multi-utility attribute analysis (MUA). It sounds complicated, but it is basically listing the pros and cons of a particular course of action.41 First, we list those geological features that can most easily be explained by one model alongside a list of those geological features which can most easily be explained by the other model. Then we make our final choice based on the model that had the most convincing list (Lindley 1971 and Moody 1983). Some points of correspondence with the visible Flood model have already been listed above, and we shall return to the details of these below since they give an additional degree of confidence in our total geological understanding of the Flood.
Table 2. Details of MUA decision table.
| Data | Support for visible Flood models | Support for cachetical Flood model | Support for uniformitarianism |
|---|---|---|---|
| Coccoliths do not settle naturally | Unequivocal support | No obvious support | No support |
| Examples of no diagenesis in thick sediments | Major support | Very limited support due to lengthening timescale | No support due to long timescale |
| Theology | Unequivocal support when we recognize that the fountains of the great deep are essential to explain the smectite, bentonite and oil | No support | No support |
| Global extinctions | Almost 100% | No mechanism, therefore no support | No support—observation only |
| End of tectonically-driven sedimentation | Full support | No support because no more global flooding | Observation only |
| Land submerged | Partial support | Partial support | Serious problems sustaining life |
| Mountain-building | Full support | No support | Observation only |
| Chalk uplift | Full support | No support | Observation only |
| The whole set of data | Almost full support | Very limited support | Hardly any support |
Implications for Decision-Making. If we had made the decision about which Flood model is tenable before understanding the revised interpretation of what was erroneously called the Tedbury “hardground,” we would have had one more item on the list of factors that support the cachetical/Recolonization model, but it should not have been such a significant item that it would have swayed the decision in favour of believing in such a model. Because our understanding of geology is continuing to develop, there are going to be changes to our understanding of the relative importance of various features which contribute to our choice of Flood model.42 But if we already have a large number of features which support one of the models, then it is unlikely that we will have made a mistake. If you can trust the Bible, then you have to go for a visible evidence model of the Flood anyway.
The final decision
We now assemble all the data discussed in a tabular form.
The resulting Table 2 shows that there is very little doubt but that:
- The Flood left visible evidence, and in particular, was responsible for the bulk of the chalk deposits of Europe;
- Cachetical/Recolonization models perform badly in the decision-making process if they wish to make chalk a post-Flood deposit; and
- Uniformitarianism performs badly in the decision-making process.
The other data in the paper show that the age of the chalk is less than 10,000 years, and so are all other parts of the rock column that hold over-pressured reservoirs.
On a global scene, the story on chalk may be slightly different, but the principles are the same. It is wrong to use the geological column as a time-line to compare events in other parts of the world, because it seems riddled with inconsistencies.
We should not wait for more data, but accept these as over-riding conclusions now.
Implications
A discussion on decision-making within a domestic, industrial and Christian context has been made. This effectively says that the story of chalk is complete—that chalk is a Flood deposit and its other proximal “Upper Cretaceous” deposits. The age of the chalk is less than 10,000 years.
The other rocks beneath the chalk (to basement) are therefore also Flood deposits and their ages must be less than 10,000 years.
Christians should be willing, rather than reluctant, to promote the principle that the bulk of the fossil-bearing rocks under our feet are a visible reminder of the awesomeness of the biblical Flood. But the judgment shown by God during that event followed warnings of what was going to happen and that the Ark would provide safety (2 Peter 2). The New Testament equivalent is that the sacrificial death of Christ provides a means for the atonement of sin.
References
Ager, D. V. 1993. The nature of the stratigraphical record. New York: John Wiley & Sons.
Ager, D. V. 1996. The new catastrophism. Cambridge, UK: Cambridge University Press.
Ali, N., and T. Alcock. 1994. Valhall Field, Norway—the first 10 years. In North Sea oil and gas reservoirs, III, eds. B. E. Aasen, A. Buller, O. Hjemland, R. M. Holt, J. Kleppe, and O. Torsater, pp. 25–40. London: Graham and Trotman.
Ameen, M. S., and J. Cosgrove. 1990. Kinematic analysis of the Ballard Down Fault, Swanage, Dorset. Proceedings of the Geologists’ Association 101(2):119–129.
Ameen, M. S, and J. Cosgrove. 1991. An upper strain detachment model for the Ballard Down fault: Discussion. Proceedings of the Geologists’ Association 101(4):303–320.
Archer, J., and C. Wall. 1986. Petroleum engineering—principles and practice. London: Graham and Trotman.
Arkell, W. 1947. The geology of the country around Weymouth, Swanage, Corfe and Lulworth. Her Majesty’s Stationery Office: London.
Atkinson, D. 1990. The message of Genesis 1–11. The Bible speaks today. Leicester, UK: Inter-Varsity Press.
Bennett, M. R., and N. F. Glasser. 1996. Glacial geology. New York: Wiley.
Bird, E. 1995. Geology and scenery of Dorset. Bradford, UK: Ex Libris Press.
Bjørlykke, K., T. Nedkvite, M. Ramm., and G. C. Saigal. 1992. Diagenetic process in the Brent Group (Middle Jurassic) reservoirs of the North Sea: An overview. In Geology of the Brent Group, eds. A. C. Morton, R. S. Haszeldine, R. S. Giles, and S. Brown, special publication 61, pp. 263–287. London: The Geological Society.
Briegel, U., and U. Xiao. 2001. Paradoxes in geology. Amsterdam: Elsevier.
Bowden, M. 1998. True science agrees with the Bible. Bromley, UK: Sovereign Press.
Bush, A. 2008. Noah’s Ark zoo farm: An update. Journal of the Biblical Creation Society 48:15–19.
Carter, D. C. 1991. An upper strain detachment model for the Ballard Down fault: Discussion. Proceedings of the Geologists’ Association 102:309–320.
Cayley, G. 1987. Hydrocarbon migration in the central North Sea. In Petroleum geology of north west Europe, eds. J. Brooks and K. Glennie, pp. 549–555. London: Graham and Trotman.
Denton, M. 1986. Evolution: A theory in crisis. Bethesda, Maryland: Adler and Adler.
Doré, A., G., and B. Vining. 2005. Petroleum geology: NW Europe and global perspectives. London: The Geological Society.
Duff, K. L., A. P. McKirdy, and M. J. Hartley. 1984. New sites for old—a students’ guide to the geology of the Mendips. Swindon, UK: Nature Conservancy Council.
Fritsen, A., and T. Corrigan. 1990. Establishment of a geological fracture model for dual porosity simulation of the Ekofisk Field. In North Sea oil and gas reservoirs, II, eds. A. E. Buller, E. Berg, O. Hjemeland, and J. Kleppe, pp. 173–184. London: Graham and Trotman.
Funnel, B. M. 1990. European Cretaceous shorelines, stage by stage. In Cretaceous resources, events and rhythms: Background and plans for research, eds. R. Ginsberg and B. Beaudoin, pp. 221–235. Dordrecht, The Netherlands: Kluwer Academic Press.
Gallois, R. W, and F. H. Edmunds. 1965. British regional geology—the Wealden district. London: National Environmental Research Council, Her Majesty’s Stationery Office.
Garton, M. 1996. The pattern of fossil tracks in the geological record. Creation Ex Nihilo Technical Journal 10(1):82–100.
Goudie, A. 1990. The landforms of England and Wales. London: Blackwell.
Goudie, A., and D. Brunsden. 1997. East Dorset coast. London: The Geographical Association.
Hancock, J. M. 1983. The setting of chalk and its initial accumulation. Joint Association of Petroleum Education Courses (JAPEC) course notes, No. 20. London, UK.
Hancock, J. M., and E. G. Kaufmann. 1979. The greater transgressions of the Late Cretaceous. Journal of the Geological Society 136:175–186.
Hancock, J. M., and P. F. Rawson, 1992. Cretaceous. In Memoir 13, Atlas of Palaeogeography and Lithofacies, eds. J. C. W. Cope, J. K. Ingham, and P. F. Rawson, pp. 131–139. London: The Geological Society.
Hardman R. F. P. 1983. Chalk hydrocarbon reservoirs of the North Sea. Joint Association of Petroleum Education Courses (JAPEC) course notes, No. 20. London, UK.
Hart, M. 1983. The chalk of the North Sea—Biostratigraphy. Joint Association of Petroleum Education Courses (JAPEC) course notes, No. 20. London, UK.
Hayward, A. B. 1984. Hemipelagic chalks in a clastic submarine fan sequence—Miocene S. W. Turkey. In Fine-grained sediments: Deep-water processes and facies, special publication 15, pp. 453–467. London: The Geological Society.
House, M. 1989. Geology of the Dorset coast. London: The Geologists’ Association Guide.
House, M. 1995. Dorset dolines part 3. Eocene pockets and gravel pipes in the chalk of St Oswald’s Bay. Dorset Natural History and Archaeological Society Journal 117, 109–116.
Insole, A., B. Daley, and A. Gale. 1999. The Isle of Wight. London: The Geologists’ Association Guide.
Kauffman, E. 1979. The ecology and biogeography of the C-T extinction event. In Cretaceous-Tertiary boundary events: Symposium, eds. W. K. Christensen and T. Birklund, pp. 29–37. University of Copenhagen, Denmark.
Keen, P., and M. Morton. 1978. Decision support systems—an organisational perspective. Reading, USA: Addison-Wesley.
Kennedy, W. 1983. Depositional mechanisms in North Sea chalks. Joint Association of Petroleum Education Courses (JAPEC) course notes, No. 20. London, UK.
Kidner, D. 1967. Genesis—an introduction and commentary. London: The Tyndale Press.
Kleppe, J. (ed). 1987. North Sea oil and gas reservoirs. London: Graham and Trotman.
Krauskopf, K. and D. Bird. 1995. An introduction to geochemistry. New York: McGraw-Hill.
Lee, P. 1997. Bayesian statistics. London: Arnold.
Lerche, I. 1990. Basin analysis. San Diego: Academic Press.
Lindley, D. 1971. Making decisions. New York: Wiley.
Matthews, J. D. 2008a. Human Sexuality—from premise to conclusion. The Reader. UK: Central Readers’ Board. Retrieved from www.jurassicark.org.uk
Matthews, J. D. 2008b. The origin of oil: A creationist answer. Answers Research Journal 1:145–168.
Megson, J. B. 1992. The North Sea chalk play: Examples from the Danish Central Graben. In Exploration Britain, geological insights for the next decade, ed. R. F. P. Hardman, special publication 67, pp. 247–282. London: The Geological Society.
Miller, G. 1974. Psychology—the science of mental life. Harmonsworth, UK: Pelican.
Moody, P. 1983. Decision making. New York: McGraw-Hill.
Mortimore, R. N., C. J. Woods, and R. W. Gallois. 2001. British Upper Cretaceous stratigraphy. London: Geological Conservation Review Series.
Muggeridge, A., Y. Abaioglu, W. England, and C. Smalley. 2005. The rate of pressure dissipation from abnormally pressured compartments. Bulletin American Association Petroleum Geologists 89(1):61–80.
Nelson, B. 1931. The deluge story in stone. Reprinted 1968. Minneapolis, USA: Bethany Fellowship.
Pettijohn, F. J. 1975. Sedimentary rocks. New York: Harper and Rowe.
Price, M. 1985. Introducing groundwater. London: Chapman and Hall.
Rao, L. R. 1964. The problem of the Cretaceous-Tertiary boundary with special reference to India and adjacent countries. Bangalore: Mysore Geologists’ Association.
Rawson, P. 1992. Cretaceous. In Geology of England and Wales, eds. P. Duff and A. Smith, pp. 355–388. London: The Geological Society.
Rayner, D. H. 1981. The stratigraphy of the British Isles. Cambridge, UK: Cambridge University Press.
Raup, D. 1991. Extinctions: Bad genes or bad luck? Oxford, UK: Oxford University Press.
Sivia, D. 1996. Data analysis. Oxford, UK: Claredon Press.
Snelling, A. A. 1994. Can Flood geology explain thick chalk layers? Creation Ex Nihlo Technical Journal 8(1):11–15.
Sulak, R., G. Nossa, and D. Thompson. 1990. Ekofisk Field enhanced recovery. In North Sea oil and gas reservoirs, II, eds. A. Buller, E. Berg, O. Hjemeland, O Torsater, J. O. Aasen, and J. Kleppe, pp. 281–296. London: Graham and Trotman.
Summerfield, M. A. 1991. Global geomorphology. London: Longman Scientific & Technical.
Thorne, J., and D. Brunsden. 1977. Geomorphology and time. London: Meuthen and Co.
Tucker, M. A. 1981. Sedimentary petrology. London: Blackwell Scientific Publications.
Tyler, D. J. 1996. A post-Flood solution to the chalk problem. Creation Ex Nihilo Technical Journal 10(1):107–113.
Tyson, R. V., and B. M. Funnel. 1990. Global and European Cretaceous shorelines, stage by stage. In Cretaceous resources, events and rhythms: Background and plans for research, eds. R. Ginsberg and B. Beaudoin, pp. 237–272. Dordrecht, The Netherlands: Kluwer Academic Press.
Underhill, J., and S. Paterson. 1998. Genesis of tectonic inversion structures: Seismic evidence for the development of key structures along the Purbeck Isle of Wight disturbance. Journal of the Geological Society, 155:975–992.
Vardiman, L., A. A. Snelling, and E. Chaffin, eds. 2005. Radioisotopes and the age of the earth: Results of a young earth creationist research initiative. El Cajon, California: Institute for Creation Research; Chino Valley, Arizona: Creation Research Society.
Vejbæk, O. V. 2008. Disequilibrium compaction as the cause for Cretaceous-Paleogene overpressures in the Danish North Sea. Bulletin American Association Petroleum Geologists 92(2):165–180.
Vogt P. R., and J. C. Holden. 1979. The end-Cretaceous extinctions. A study of the multiple working hypothesis method gone mad. In Cretaceous-Tertiary boundary events: Symposium, eds. W. K. Christensen and T. Birklund, p. 49. University of Copenhagen, Denmark.
Whitcomb, J., and H. Morris. 1961. The Genesis Flood. Nutley, New Jersey, USA: Presbyterian Reformed Publishing.
Wilson, H. H. 2005. A review of the geological data that conflicts with the paradigm of catagenic generation and migration of oil. Journal of Petroleum Geology 28(3): 287–300.
Wilson, M., and T. Palmer. 1992. Hardgrounds and hardground fauna. Institute of Earth Studies Publication, No. 9. University of Wales, Aberystwyth.
Woodmorappe, J. 2006. Hardgrounds and the Flood; the need for a re-evaluation. Journal of Creation, 20(3):102–110.