The views expressed in this paper are those of the writer(s) and are not necessarily those of the ARJ Editor or Answers in Genesis.
Abstract
The baraminic status of fossil hominids was tested using statistical baraminology techniques. Eight previously published cladistic studies of fossil and extant hominids were reexamined with baraminic distance correlation (BDC) and multidimensional scaling (MDS). Results indicate that hominins may be divided into as many as four different holobaramins: (1) the genus Homo (including Australopithecus sediba), (2) the genus Paranthropus, (3) Australopithecus africanus, and (4) Gorilla, Pan, Australopithecus afarensis, and Australopithecus garhi. These results tentatively confirm the common creationist claim that fossil hominids can be divided into human and non-human categories. In contrast to many creationist claims, however, the present results indicate that Homo habilis, Homo rudolfensis, and—most surprisingly—Australopithecus sediba belong in the human holobaramin. Future studies should focus on including postcranial characters in baraminic distance calculations and developing a model for understanding biological similarity and the significance of human-like australopiths and the ape-like humans.
Keywords: baraminology, baraminic distance, Hominidae, human, paleoanthropology
Introduction
Of all the issues in the creation/evolution debate, the origin of human beings is likely the most significant. Though Darwin assiduously avoided the subject of human evolution in Origin, the possibility of human evolution was obvious to the public. Reactions ranged from Huxley’s (1863) championing of human evolution in Man’s Place in Nature to the outright condemnation of Adam Sedgwick (1860). Even those inclined to accept much of Darwin’s evolution still drew the line at a bestial origin of human beings. Entomologist Erich Wasmann (1909) conceded that an evolutionary origin of mammals was likely, but he attributed the origin of humanity to a separate creation. Likewise, although William Jennings Bryan is famous for his opposition to evolution, he only opposed human evolution not the evolution of lower creatures (Bryan 1922).
Despite this widespread agreement that evolution cannot account for human origins, the question remains: What precisely is human (that is, descendants of Adam and Eve)? This is a problem not appreciated in the heyday of antievolutionism around the Scopes trial, when the list of legitimate fossil hominids was quite limited. Today, however, there are around 20 fossil hominid species known from around the world, including partial skeletons of Homo ergaster (Brown et al. 1985), H. habilis (Johanson et al. 1987), Australopithecus afarensis (Johanson et al. 1982), Au. sediba (Berger et al. 2010), and Ardipithecus ramidus (Lovejoy et al. 2009). Many of these possess a mix of traits found in extant apes and modern humans (for a simple demonstration, see Senter 2010).
Creationists do not agree on which of these fossil taxa are human. Most extreme are the old-earth creationists Rana and Ross (2005), who accept only modern Homo sapiens sapiens as human. Nearly all young-earth creationists accept Neanderthals as human and australopiths as not human, but opinions on other members of the genus Homo vary. Homo erectus (sensu lato, including H. ergaster) is viewed as human by Hartwig-Scherer (1998), Lubenow (2004, chap. 12), and Wise (2005). In contrast, Gish (1995, pp. 304–305) and Bowden (1981, pp. 208–210) view H. erectus as a mix of ape and human specimens, and Cuozzo (1998, p. 101) labeled H. erectus an ape. Gish (1995, p. 279) and Hartwig-Scherer (1999) classify Homo habilis as ape, but H. habilis is considered to be a mix of ape and possibly human specimens by Lubenow (2004, pp. 299–301). The skull KNM-ER 1470 (Homo rudolfensis) is accepted as possibly human by Bowden (1981, p. 200), Cuozzo (1977), and Lubenow (2004, pp. 328–329), while Hartwig-Scherer and Brandt (2007) and Mehlert (1999) consider it an ape. The recently-discovered Flores remains (Brown et al. 2004) are considered human by Wise (2005), and the Dmanisi hominids (Gabunia et al. 2000) are considered very similar to australopiths by Hartwig-Scherer (2002a).
The divergence of opinion among creationists has been exploited by anticreationists (for example, Isaak 2007, p. 106; Miller 2008, pp. 93–95). If humans truly evolved gradually from nonhuman ancestors, then it would come as no surprise that we would have difficulty drawing the line between “human” and “ape.” Alternatively, one might point to the fragmentary and incomplete nature of many of the most significant taxa as a legitimate source of confusion. Indeed, given that conventional paleoanthropologists continue to disagree about the precise phylogenetic significance of even some quite complete fossils (for example, Ackermann and Smith 2007; Harrison 2010; Prat 2004; Tobias 2009; B. Wood 2009), it should be no surprise that creationists also disagree. Furthermore, it is unreasonable to expect nonexperts with little or no direct experience with fossil hominid material to agree on hominid classification. Nevertheless, among the most knowledgeable creationist scholars, there is a general consensus that the human holobaramin includes Homo sapiens, H. neanderthalensis, and H. erectus, that australopiths are apes, and that the status of H. habilis is uncertain.
In addition, creationists historically lacked a means of interpreting the relationships of fossils and their predicted discontinuities. In 1999, Robinson and Cavanaugh introduced statistical baraminology methods that have been further developed and applied to numerous extant and fossil taxa (for example, T. Wood 2005, 2008a, 2008b). These techniques have been criticized (for example, Williams 2004), but the results have shown some evidence of discontinuity at approximately the level of family (T. Wood 2008b, 2009). Application of these methods to the Hominidae may clarify the relationships of these fossil taxa.
Given the consensus creationist view on fossil hominids discussed above, we may make three predictions. First, there should be a monobaramin containing Homo sapiens, H. neanderthalensis, and H. erectus. Second, there should be a discontinuity or at least a lack of continuity between the Homo monobaramin and species of the genera Australopithecus and Paranthropus (the so-called robust australopiths). Third, the questionable taxa H. habilis and H. rudolfensis should group with either the Homo monobaramin (and therefore be human) or with the australopiths; they should not occupy an intermediate position. By contrast, an evolutionary interpretation would predict continuity between Australopithecus and Homo.
Methods
Nomenclature
Table 1. Classification and nomenclature used in this study (modified from Table 1 in Wood and Richmond [2000] and Table 1 in Wood and Lonergan [2008]).
Family Hominidae
Subfamily Ponginae
Genus Pongo
Subfamily Gorillinae
Genus Gorilla
Subfamily Homininae
Tribe Panini
Genus Pan
Species troglodytes, paniscus
Tribe Hominini
Subtribe Australopithecina
Genus Sahelanthropus
Species tchadensis
Genus Orrorin
Species tugenensis
Genus Ardipithecus
Species ramidus
Genus Australopithecus
Species africanus, afarensis, garhi,
anamensis, sediba
Genus Paranthropus
Species boisei, robustus, aethiopicus
Genus Kenyanthropus
Species platyops
Subtribe Hominina
Genus Homo
Species habilis, rudolfensis, erectus, ergaster,
floresiensis, rhodesiensis, antecessor,
heidelbergensis, neanderthalensis, sapiens
Since there is inconsistency of hominid species nomenclature even among the studies cited here, a consistent nomenclature was adopted for reporting results of these analyses (Table 1). This nomenclature is not meant to be a serious taxonomic proposal but instead to create a pragmatic uniformity of usage among disparate datasets. In brief, the “robust australopiths” boisei, robustus, and aethiopicus are referred to the genus Paranthropus. In light of the far more common usage, the genus Australopithecus is used instead of the proposed genus Praeanthropus for the species afarensis. Also for consistency with common usage, KNM-ER 1470 is placed in the genus Homo (species rudolfensis) rather than Kenyanthropus. In this study, taxa will be referred to by these names rather than different names that might have been used in the original published research.
Data
Datasets for statistical analysis were selected from the literature. Wood and Murray (2003, p. 117) recommend a “balanced and broad-based” dataset of characters for statistical baraminology. Practically, this has been interpreted to mean that datasets with a variety of character types are preferred to datasets of just one type of character, for example, dental or molecular. Similarly, datasets with many characters are preferred to those with just a few. For this study, datasets were chosen based on their sampling of species from Homo and Australopithecus, the use of craniodental rather than just dental characters, and the number of characters available. Eighteen datasets were screened for suitability: Argue et al. (2009), Asfaw et al. (1999), Begun and Kordos (1997), Begun, Ward, and Rose (1997), Berger et al. (2010), Gibbs, Collard, and Wood (2002), Grehan and Schwartz (2009), Lieberman, Wood, and Pilbeam (1996), Lordkipanidze et al. (2007), McHenry (1996), Prat (2004), Shoshani et al. (1996), Skelton and McHenry (1992), Smith and Grine (2008), Strait, Grine, and Moniz (1997), Strait and Grine (2001), Strait and Grine (2004), and Zeitoun (2000).
Of the eighteen datasets screened, only Berger et al. (2010); Smith and Grine (2008); Strait, Grine, and Moniz (1997), and both datasets from Strait and Grine (2001; 2004) included more than three species each of Australopithecus/Paranthropus and Homo. Argue et al. (2009) included seven Homo species (including floresiensis and the Dmanisi specimens) but only two Australopithecus species (afarensis and africanus). Zeitoun (2000) and Prat (2004) included specimens as taxa in their analyses instead of species. In Zeitoun’s study of H. erectus, 62 specimens classified as Homo were analyzed along with four outgroup taxa: gorilla, chimpanzee, Sts 5 (“Mrs. Ples,” Australopithecus africanus), and KNM-ER 406 (Paranthropus boisei). Prat’s 25 specimens included thirteen classified as Homo, four Australopithecus, five Paranthropus, chimpanzee, gorilla, and KNM-WT 40000 (Kenyanthropus platyops). These datasets are summarized in Table 2. The remaining datasets were not used in this study because of their poor sampling of Homo or Australopithecus/Paranthropus taxa.
Table 2. Datasets screened for this study. For this table, Aust. includes Australopithecus and Paranthropus. *Zeitoun’s (2000) and Prat’s (2004) analyses use specimens rather than taxa.
| Source | Taxa (Aust./Homo) | Characters | Missing Character States | Type |
|---|---|---|---|---|
| Strait et al. (1997) | 10 (5/4) | 60 | 28 (4.7%) | Craniodental |
| Zeitoun (2000) | 66 (62/2*) | 468 | 13,724 (44.4%) | Cranial and craniometric |
| Strait and Grine (2001) | 13 (7/4) | 69 | 176 (19.6%) | Craniodental |
| Prat (2004) | 25 (13/9*) | 122 | 1169 (38.3%) | Craniodental |
| Strait and Grine (2004) | 20 (4/4) | 198 | 1262 (31.9%) | Craniodental and craniometric |
| Smith and Grine (2008) | 19 (4/4) | 99 | 601 (32.0%) | Craniodental |
| Argue et al. (2009) | 12 (2/7) | 60 | 111 (15.4%) | Craniodental |
| Berger et al. (2010) | 10 (7/3) | 69 | 55 (8.0%) | Craniodental |
Analysis
Statistical analysis was performed using BDISTMDS v. 2.0 at http://www.bryancore.org/bdistmds.html (Wood 2008a). For baraminic distance calculations, characters are omitted that do not meet a minimum criterion of character relevance. In previous studies (for example, Wood 2008b), taxa have also been omitted due to excessively incomplete character states. In the present analysis, taxa were omitted to raise the number of characters included in the baraminic distance calculations to at least 50% of the published dataset, while retaining at least a 75% character relevance cutoff (with preference for a >85% cutoff). For the Strait, Grine, and Moniz (1997) dataset, all ten taxa were included, and the character relevance cutoff of 0.95 left 41 of the 60 characters for baraminic distance calculation. For the Zeitoun (2000) dataset, taxa with more than 60% of their character states unknown were omitted. The 24 omitted taxa were thirteen H. erectus specimens (Arago XLVII, Arago XXI, Ngangdong II, Ngangdong III, Ngangdong V, Sangiran 3, Sangiran 4, Sangiran 10, Sangiran 12, Sangiran 26, Sangiran 38, Sinanthropus 10, and Trinil 2), nine H. sapiens (Bodo 1, Maba, Ndutu, Omo Kibish 2, Salé, Swanscombe, Velika Pecina, WHL 50, and Zuttiyeh), one H. neanderthalensis (Shanidar 5), and one H. rhodesiensis (Saldanha). The reduced Zeitoun dataset of 42 taxa at 0.75 character relevance retained 246 characters for baraminic distance calculations. For the dataset of Strait and Grine (2001), taxa with more than 65% of their character states unknown were omitted (Au. anamensis, Au. garhi, and Ar. ramidus). At a relevance cutoff of 0.95, 45 characters were used to calculate baraminic distances. For Prat’s (2004) dataset, eight taxa with more than 50% of their character states unknown were omitted: three H. habilis (OH 62, OH 13, OH 16) and one each of H. ergaster (ER370), H. rudolfensis (ER 3732), Au. afarensis (AL333-45), K. platyops (WT 40000), and P. robustus (SK 46). The dataset with the remaining seventeen taxa retained 67 of the 122 original characters for baraminic distance calculation (relevance cutoff: 0.8). Four taxa were eliminated from Strait and Grine’s (2004) dataset: Au. anamensis, Au. garhi, Ar. ramidus, and K. platyops. All four had more than 65% of their character states unknown. For the remaining fifteen taxa, 115 characters out of 198 were used for baraminic distance calculation (relevance cutoff: 0.9). Six taxa with more than half of their character states unknown were omitted from the Smith and Grine (2008) dataset: South African Homo, SK 847, Au. anamensis, Au. garhi, Ar. ramidus, and K. platyops. For the remaining thirteen taxa, 53 of 98 characters were used for baraminic distance calculation (relevance cutoff: 0.9). H. rudolfensis was omitted from Argue et al.’s (2009) dataset because only 35% of its character states were known. For the remaining eleven taxa, 43 of 60 characters were used to calculate baraminic distances (relevance cutoff: 0.9). For Berger et al.’s (2010) dataset, Pan and Homo sapiens were added to the taxon sample using published information from Collard and Wood (2000), Skelton and McHenry (1992), and Smith and Grine (2008). At a relevance cutoff of 0.85, 35 characters were used to calculate baraminic distances (corresponding to characters 1-2, 4-15, 18-19, 21-22, 26-28, 39, 41, 43-44, 47-49, 51-53, 56, 59, 68-69 from Berger et al.’s table 1). All baraminic distance correlation tests were run with 100 bootstrap samples.
Results
The datasets used by Smith and Grine (2008), Strait, Grine, and Moniz (1997), and Strait and Grine (2001; 2004) are variations of the same set of characters. Strait and Grine (2001) modified the character coding of ten characters and added nine. The third version of the dataset expanded the character sample to 109 discrete and 89 craniometric characters (Strait and Grine 2004). The coding of six character states were modified. Smith and Grine’s (2008) version of the dataset contains only 99 of the discrete characters, with sixteen modified characters (Smith and Grine 2008). Consequently, these datasets will be considered together.
Strait, Grine, and Moniz (1997)
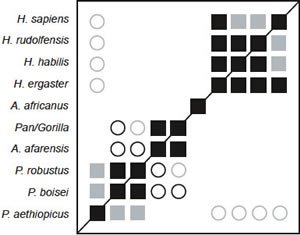
Fig. 1. BDC results for the dataset of Strait, Grine, and Moniz (1997). Squares indicate taxa with significant, positive BDC; circles indicate taxa with significant, negative BDC. Black symbols have bootstrap values (100 replicates) >90%; gray symbols have bootstrap values ≤90%.
Baraminic distance correlation (BDC) results for the Strait, Grine, and Moniz dataset are shown in Fig. 1. All four species of Homo in the dataset share significant, positive BDC, as do the three Paranthropus species. Au. afarensis is positively correlated with the Pan/Gorilla taxon. Au. africanus is not correlated with any other taxa. Significant, negative BDC is observed between two of the Paranthropus species (boisei and robustus) and the group composed of Au. afarensis and Pan/Gorilla. Negative correlation is also observed between the Homo species and P. aethiopicus. Bootstrapping support is moderate, with a median bootstrap of 86% and only 48.9% of the taxon pairs having bootstrap values >90%. Two species pair within the Homo group have <90% bootstrap support: sapiens/rudolfensis (66%) and sapiens/habilis (67%). Nevertheless, the positive correlation between H. ergaster and habilis/rudolfensis has >90% bootstrap support.
The 3D multidimensional scaling (MDS) results are of excellent quality, with a stress of only 0.076. The minimal stress for this dataset (0.059) occurs at four dimensions. The 3D MDS results show at least three groups: Homo, Paranthropus, and Pan/Gorilla/Au. afarensis (fig. 2). Au. africanus could be interpreted as part of the Homo group or as a taxon separate from all three groups. Given the lack of positive BDC between Homo species and Au. africanus, the latter seems more likely. P. aethiopicus is set apart from the other two Paranthropus species. The calculated baraminic distances between aethiopicus and robustus is 0.317 and between aethiopicus and boisei is 0.293, whereas the calculated baraminic distance between robustus and boisei is 0.195. The Homo species form an arc shape, with habilis and rudolfensis close together at one end and sapiens at the other. The habilis/rudolfensis end is close to Au. africanus with calculated baraminic distances of 0.341 and 0.293 respectively. There are no taxa directly intermediate between Homo and Paranthropus or between Homo and Pan/Gorilla/Au. afarensis.
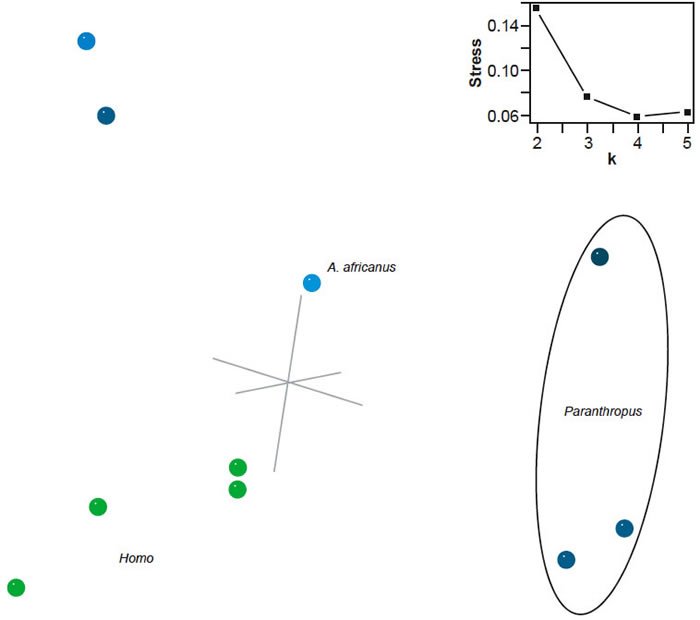
Fig. 2. Three-dimensional MDS results for the dataset of Strait, Grine, and Moniz (1997). Taxa assigned to genus Homo are shown in green; other taxa in blue. Inset: stress of k-dimensional MDS as a function of the number of dimensions (k).
Strait and Grine (2001)
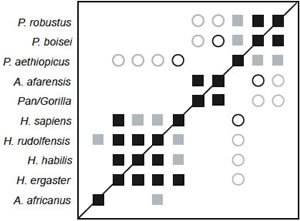
Fig. 3. BDC results for the dataset of Strait and Grine (2001). Squares indicate taxa with significant, positive BDC; circles indicate taxa with significant, negative BDC. Black symbols have bootstrap values (100 replicates) >90%; gray symbols have bootstrap values ≤90%.
BDC results reveal three groups of taxa (fig. 3), one corresponding to Homo species, one to Paranthropus, and one consisting of Au. afarensis and the Pan/Gorilla composite taxon. Au. africanus is positively correlated with H. rudolfensis, although bootstrap support for this correlation is only 62%. Within each group significant, positive BDC is observed between all taxa, and no positive BDC is observed between the groups. Significant, negative BDC occurs between two Paranthropus species (robustus and boisei) and the Pan/Gorilla/Au. afarensis taxa and between P. aethiopicus and all Homo species. The bootstrap results are comparable to the Strait, Grine, and Moniz (1997) dataset. The median bootstrap value was 88%, and 42.2% of taxon pairs had bootstrap values >90%.
As expected, the 3D MDS results closely resemble those of the Strait, Grine, and Moniz (1997) dataset (fig. 4). The same clusters from the BDC results are also visible in the 3D MDS. The Homo taxa form a tight cluster separated from Au. africanus, and Paranthropus aethiopicus is separated from the remaining Paranthropus species. Pan/Gorilla and Au. afarensis form the third main cluster. As in the case of the Strait, Grine, and Moniz (1997) dataset, of only 0.066 and a minimal stress of 0.063 at four dimensions.
Fig. 4. Three-dimensional MDS results for the dataset of Strait and Grine (2001). Taxa assigned to genus Homo are shown in green; other taxa in blue. Inset: stress of k-dimensional MDS as a function of the number of dimensions (k).
Strait and Grine (2004)
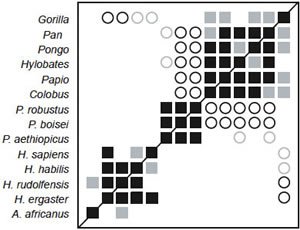
Fig. 5. BDC results for the dataset of Strait and Grine (2004). Squares indicate taxa with significant, positive BDC; circles indicate taxa with significant, negative BDC. Black symbols have bootstrap values (100 replicates) >90%; gray symbols have bootstrap values ≤90%.
Three distinct groups are visible in the BDC results for Strait and Grine’s (2004) dataset (fig. 5). One group consists of the Paranthropus species, and a second group includes the extant apes in the dataset. Twelve of the eighteen possible taxon pairs between the two groups have significant, negative BDC. The remaining six taxon pairs between these two groups do not share significant BDC. The four species of Homo and Au. africanus comprise the third group. It is possible that Au. africanus should be excluded from the Homo group. Au. africanus is positively correlated only with H. rudolfensis, and the bootstrap support for this correlation is only 59%. Significant, negative BDC between the four Homo taxa and the other two groups is limited to comparisons with gorilla only. Based on the bootstrap outcome, these results seem only slightly better than those observed for the datasets of Strait, Grine, and Moniz (1997) and Strait and Grine (2001). The median bootstrap value for the Strait and Grine (2004) dataset is 93%, and 54.9% of taxon pairs had bootstrap values >90%.
The 3D MDS results for the Strait and Grine (2004) dataset closely resemble the 3D MDS analyses of the Strait, Grine, and Moniz (1997) and Strait and Grine (2001) datasets, although the quality of the Strait and Grine (2004) 3D MDS is lower (3D stress = 0.204, with minimal stress at 11 dimensions). In particular, the three groups observed in the Strait, Grine, and Moniz (1997) 3D MDS results are also present here and in a similar orientation (fig. 6). The only notable differences are a wider separation between habilis and rudolfensis (calculated baraminic distance of 0.400 for Strait and Grine [2004] versus 0.22 for Strait, Grine, and Moniz) and a wider separation between Au. africanus and H. rudolfensis (calculated baraminic distance of 0.389 for Strait and Grine [2004] versus 0.293 for Strait, Grine, and Moniz).
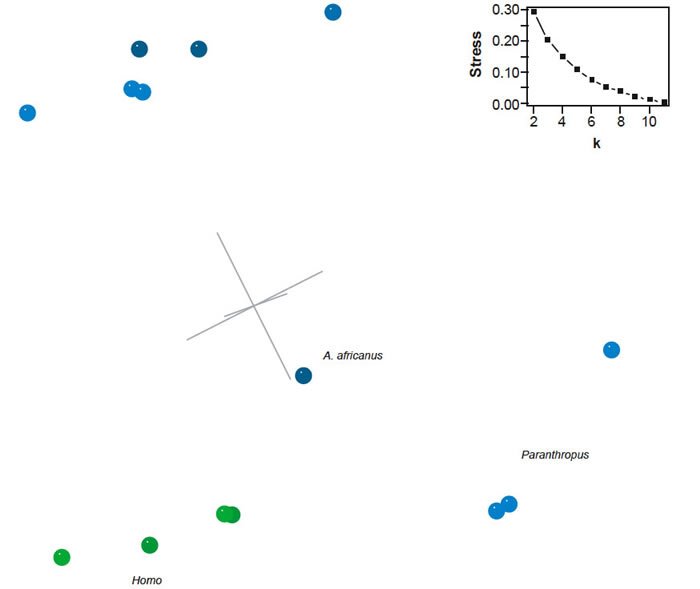
Fig. 6. Three-dimensional MDS results for the dataset of Strait and Grine (2004). Taxa assigned to genus Homo are shown in green; other taxa in blue. Inset: a stress of k-dimensional MDS as a function of the number of dimensions (k).
Smith and Grine (2008)
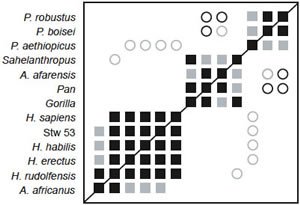
Fig. 7. BDC results for the dataset of Smith and Grine (2008). Squares indicate taxa with significant, positive BDC; circles indicate taxa with significant, negative BDC. Black symbols have bootstrap values (100 replicates) >90%; gray symbols have bootstrap values ≤90%.
As in the previous three versions of this dataset, three clear groups are visible in the BDC results: one consisting of Paranthropus species, one consisting of Homo species, Au. africanus, and Stw 53, and one consisting of Sahelanthropus, Au. afarensis, chimpanzee, and gorilla (fig. 7). Bootstrap support is moderate (median 91.5%) with 51.3% of taxon comparisons having >90% bootstrap support. Negative BDC is limited to just nine taxon pairs. P. aethiopicus is negatively correlated with Stw 53 and all Homo taxa except rudolfensis. P. robustus/boisei are negatively correlated with chimpanzee and Au. afarensis, and Sahelanthropus and H. rudolfensis are negatively correlated. Unlike the previous studies, Au. africanus is clearly a member of the Homo group, sharing significant, positive BDC with H. rudolfensis (93% bootstrap support), H. erectus (81%), H. habilis (62%), and Stw 53 (64%).
The 3D MDS results are a good representation of the baraminic distances (3D stress 0.109, minimal stress at 5 dimensions) (fig. 8). There is a clear cluster of Homo species (including Stw 53), and Au. africanus is a notable outlier from the Homo cluster. The other two groups form a diffuse cloud around one side of the Homo cluster. Unlike the 3D MDS analysis of the datasets of Strait, Grine, and Moniz (1997) and Strait and Grine (2001; 2004), in this case Au. africanus occupies a truly intermediate position between Homo and the chimpanzee/Au. afarensis cluster. The Homo taxa also form a cluster rather than an arc.
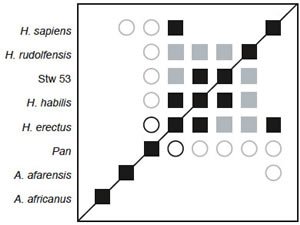
Fig. 9. BDC results for the dataset of Smith and Grine (2008), with only Au. afarensis, Au. africanus, and Pan included as outgroups. Squares indicate taxa with significant, positive BDC; circles indicate taxa with significant, negative BDC. Black symbols have bootstrap values (100 replicates) >90%; gray symbols have bootstrap values ≤90%.
The 3D MDS results imply a separation between the Homo cluster and Au. africanus, but the BDC results imply that Au. africanus should be considered part of the Homo cluster. The calculated baraminic distances support the separation of Au. africanus from Homo (including Stw 53). The average baraminic distance between Au. africanus and Homo is 0.293 (σ = 0.0747), while the average Homo/Homo (including Stw 53) distance is only 0.212 (σ = 0.0718).
Since the addition of too many outgroup taxa can influence BDC results, as seen in the case of the turtles (Wood 2005), BDC analysis was performed on a subset of Smith and Grine’s (2008) taxa that included only Homo (and Stw 53), Australopithecus, and Pan. BDC results for the Smith and Grine subset are shown in fig. 9. Bootstrap results were worse than the full dataset, with a median of 83% and only 35.7% of taxon pairs having a bootstrap value >90%. Significant, positive BDC is observed between most members of the Homo cluster, but not between Au. africanus and any member of the Homo cluster. Chimpanzee was also negatively correlated with all members of the Homo cluster.
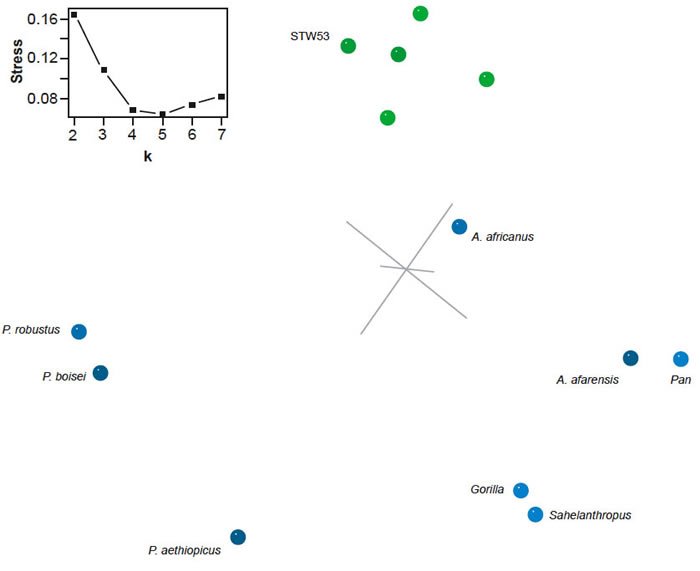
Fig. 8. Three-dimensional MDS results for the dataset of Strait and Grine (2008). Taxa assigned to genus Homo are shown in green; other taxa in blue. Inset: stress of k-dimensional MDS as a function of the number of dimensions (k).
Zeitoun (2000)
BDC results for Zeitoun’s dataset show two obvious clusters (fig. 10). One consists of 38 specimens referred to Homo and the other consists of chimp, gorilla, P. boisei (KNM-ER 406) and Au. africanus (Sterkfontein 5). Of the 152 possible taxon comparisons between the two groups, 109 are negatively correlated, and none are positively correlated. Within the Homo group, only three taxon pairs out of 703 share significant, negative BDC: OH 9/Gibraltar 2, OH 9/Teshik Tash, and OH 9/Engis 2. OH 9 is classified as H. erectus by Maier and Nkini (1986) or H. rhodesiensis by Zeitoun (2000). Gibraltar 2, Teshik Tash, and Engis 2 are Neanderthals (Tillier 1988). Otherwise most Homo taxa share significant, positive BDC with other members of Homo. There appear to be five outliers, KNM-ER 3733, OH 9, KNM-ER 3883, KNM-ER 1813, and KNM-ER 1470, which are positively correlated with two, two, eleven, one, and three other members of the Homo group, respectively. As with previous analyses in this study, bootstrap support for the BDC results is moderate (median bootstrap is 90%).
The 3D MDS results support the existence of the Homo and non-Homo groups observed in the BDC analysis (fig. 11), despite the generally poor MDS results. Stress for the 3D MDS is 0.437, and the minimal stress of 0.0271 occurs at 23 dimensions. As in the BDC results, OH 9, KNM-ER 3733, and KNM-ER 1470 appear as outliers from the otherwise tight Homo cluster. Au. africanus (Sterkfontein 5) occupies an intermediate position between the Homo cluster and gorilla.
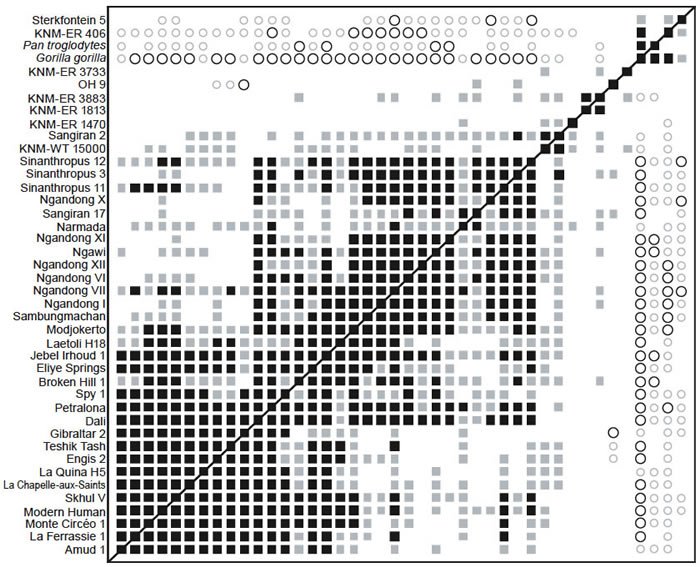
Fig. 10. BDC results for the dataset of Zeitoun (2000). Squares indicate taxa with significant, positive BDC; circles indicate taxa with significant, negative BDC. Black symbols have bootstrap values (100 replicates) >90%; gray symbols have bootstrap values ≤90%.
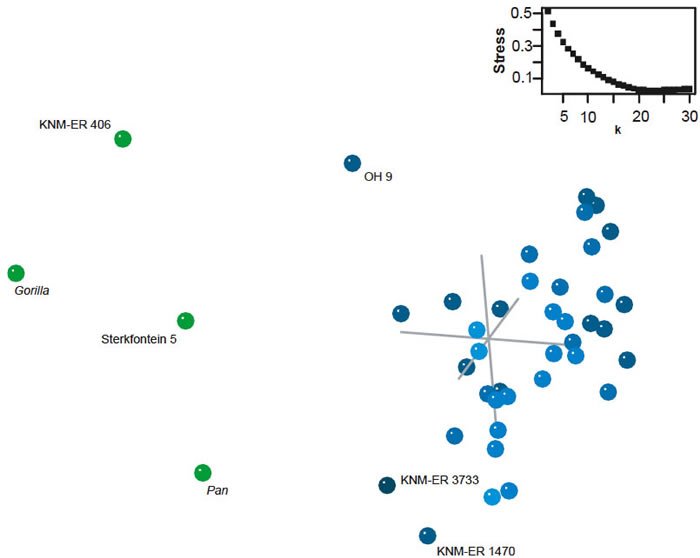
Fig. 11. Three-dimensional MDS results for the dataset of Zeitoun (2000). Taxa assigned to genus Homo are shown in blue; other taxa in green. Inset: stress of k-dimensional MDS as a function of the number of dimensions (k).
Berger et al. (2010)
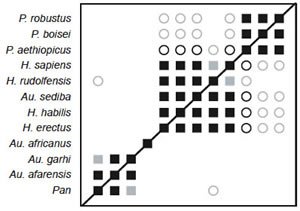
Fig. 12. BDC results for the dataset of Berger et al. (2010). Squares indicate taxa with significant, positive BDC; circles indicate taxa with significant, negative BDC. Black symbols have bootstrap values (100 replicates) >90%; gray symbols have bootstrap values ≤90%.
BDC analysis of the Berger et al. (2010) dataset supplemented with characters from Pan and Homo sapiens revealed four clear groups: (1) Paranthropus species, (2) Au. garhi, Au. afarensis, and Pan, (3) Au. africanus, and (4) Au. sediba and Homo species (fig. 12). Within each group all members share significant, positive BDC. Negative BDC occurs between members of Paranthropus and the Homo/Au. sediba group and between H. rudolfensis and Pan. Although the overall bootstrap support is poor (median 81.5%, 31.8% of taxon pairs with >90% bootstrap support), the bootstrap support for the groups is excellent. Only two taxon pairs have bootstrap values ≤90%: Pan and Au. garhi, and H. rudolfensis and H. sapiens.
The 3D MDS results (3D stress: 0.089) confirm the findings of the BDC analysis (fig. 13). The species of Paranthropus form a diffuse group separated from the remaining taxa. Pan, Au. afarensis, and Au. garhi clustered together. Within the Homo cluster, Au. sediba is closer to H. sapiens than either H. habilis or H. rudolfensis. Furthermore, Au. sediba is not adjacent to any other australopiths. Of the remaining australopiths, Au. africanus is closest to Homo but is closer to H. habilis than to Au. sediba.
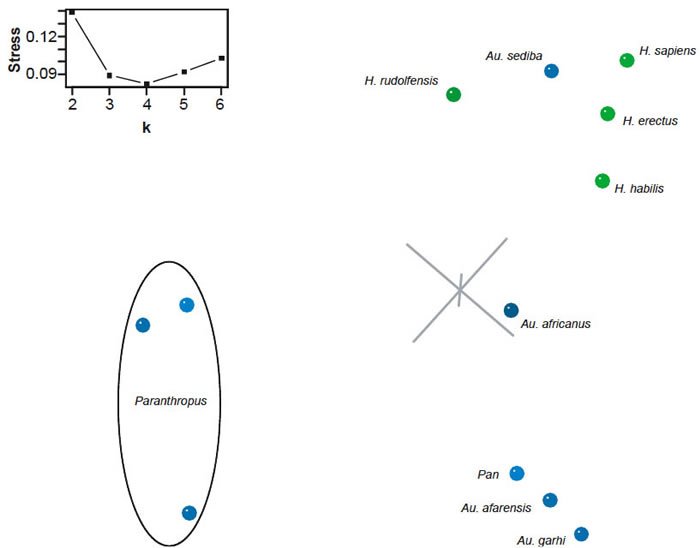
Fig. 13. Three-dimensional MDS results for the dataset of Berger et al. (2010). Taxa assigned to genus Homo are shown in blue; other taxa in green. Inset: stress of k-dimensional MDS as a function of the number of dimensions (k).
Prat (2004) and Argue et al. (2009)
BDC analysis of the datasets of Prat and Argue et al. were uninformative. For the Prat dataset (fig. 14), only three taxon pairs were positively correlated: chimpanzee/gorilla, KNM-ER 3883/KNM-ER 3733, and OH 5/KNM-ER 406. Negative BDC was observed between five taxon pairs, OH 5/KNM-ER 3883, OH 5/OH 9, SK 48/KNM-ER 1470, KNM-ER 406/OH 9, and KNM-ER 1805/OH 24. Bootstrap support was moderate, with a median of 93%. Results of the 3D MDS analysis show a diffuse cloud of taxa with most members of Homo on one side. One specimen referred to Homo, KNM-ER 1805, appeared on the opposite end of the cluster from the remaining Homo specimens. The 3D MDS results were moderately poor, with a 3D stress of 0.308 and minimal stress at nine dimensions.
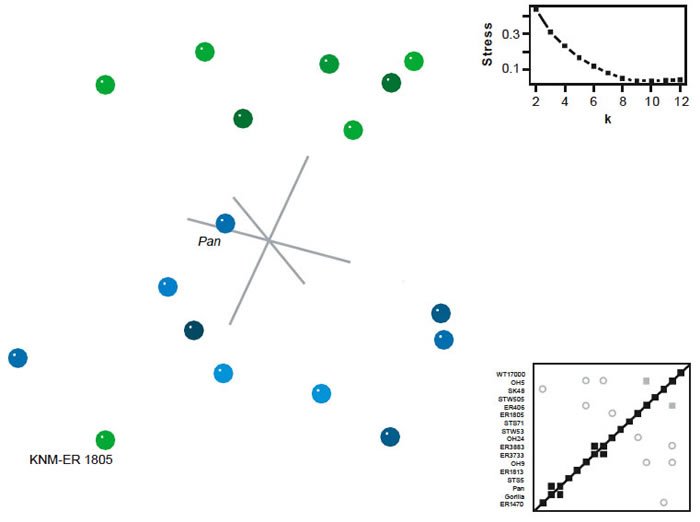
Fig. 14. BDC and MDS results for the dataset of Prat (2004). For BDC diagram, squares indicate taxa with significant, positive BDC; circles indicate taxa with significant, negative BDC. Black symbols have bootstrap values (100 replicates) >90%; gray symbols have bootstrap values ≤90%. For MDS, taxa assigned to genus Homo are shown in green; other taxa in blue. Inset: stress of k-dimensional MDS as a function of the number of dimensions (k).
For the Argue et al. (2009) dataset, only three taxon pairs shared significant BDC (fig. 15). H. ergaster and H. rhodesiensis were positively correlated, and negative BDC was observed between H. floresiensis and Au. afarensis and between H. rhodesiensis and Au. africanus. Bootstrap support for all three of these correlations was poor (63%, 41%, and 30%, respectively). As with Prat’s (2004) dataset, the 3D MDS for the Argue et al. data revealed a diffuse cloud of taxa. Members of Homo appear on one side of the cloud, and non-Homo taxa appear on the other. Unlike the Prat (2004) dataset, the 3D MDS results were not especially poor, with a 3D stress of 0.223 and minimal stress at six dimensions. Nevertheless, significant grouping of the taxa was not observed.
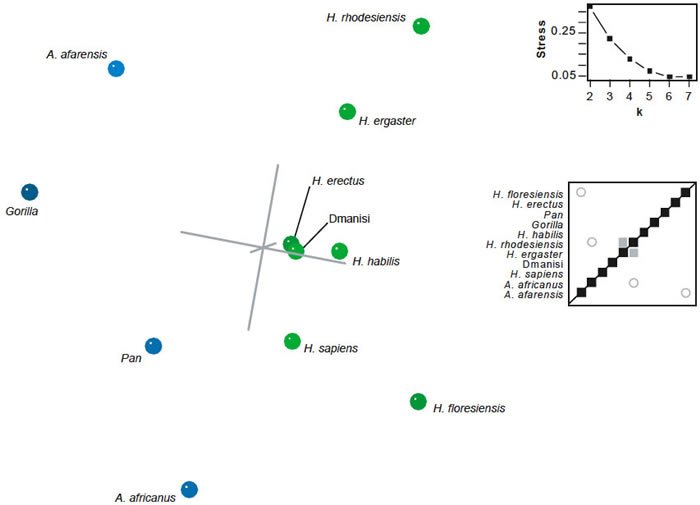
Fig. 15. BDC and MDS results for the dataset of Argue et al. (2009). For BDC diagram, squares indicate taxa with significant, positive BDC; circles indicate taxa with significant, negative BDC. Black symbols have bootstrap values (100 replicates) >90%; gray symbols have bootstrap values ≤90%. For MDS, taxa assigned to genus Homo are shown in green; other taxa in blue. Inset: stress of k-dimensional MDS as a function of the number of dimensions (k).
Discussion
The Human Holobaramin
The BDC and MDS analyses presented here suggest that the genus Homo (subtribe Hominina) is a holobaramin. Continuity between homininans is supported by significant, positive BDC in the datasets of Berger et al. (2010), Smith and Grine (2008), Strait, Grine, and Moniz (1997), Strait and Grine (2001; 2004), and Zeitoun (2000). In each of these cases, 3D MDS confirmed that the homininans formed a cluster or arc separated from other taxa.
Most surprising, three controversial taxa appear to be unequivocally grouped with the homininans: Homo habilis, Homo rudolfensis, and Australopithecus sediba. As noted above, Hartwig-Scherer (1999) considers H. habilis an australopith, but Lubenow (2004, pp. 299–301) and Line (2005a) believe some H. habilis specimens might be human. Additional creationists who reject the human status of H. habilis include Gish (1995, p. 279), Hummer (1979), Mehlert (1996), Murdock (2006), and Young (2006). Likewise, though Lubenow (2004, pp. 328–329) and Cuozzo (1977) believe H. rudolfensis to be human, Hartwig-Scherer and Brandt (2007) consider it a kind of ape. As of this writing, there has been no creationist commentary or interpretation of Au. sediba, but given sediba’s extremely ape-like forearms (Berger et al. 2010), it seems likely that many creationists would prefer to place sediba among the australopiths.
Despite these contradictory opinions, the present results strongly support the classification of all three species in the human holobaramin. All analyses showed all three taxa clearly clustering with other homininans and separately from other australopiths. The position of Au. sediba is especially clear. It was positively correlated with all Homo species (with bootstrap values >90%) and did not positively correlate with any australopiths. Even conventional paleoanthropologists disagree on the classification of sediba (see Balter 2010). In light of the present findings, it seems more appropriate to refer sediba to genus Homo.
Discontinuity between Homo and outgroup taxa (Australopithecus, Paranthropus, chimpanzee, gorilla, etc.) is most strongly supported by the BDC analysis of Zeitoun’s (2000) dataset, which demonstrated significant, negative BDC between Homo specimens and outgroup taxa. Negative correlation was observed only infrequently in the BDC analysis of the Berger et al. (2010), Smith and Grine (2008), Strait, Grine, and Moniz (1997), and Strait and Grine (2001; 2004) datasets, but the separation of the homininans from outgroup taxa observed in the 3D MDS of these datasets supports the inference of discontinuity.
The position of Au. africanus is somewhat less clear. In the BDC analysis of the datasets of Strait and Grine (2001; 2004) and Smith and Grine (2008), Au. africanus was positively correlated with one and four homininans respectively. In both cases, Au. africanus appeared as an outlier from the Homo cluster in 3D MDS. In the case of Strait and Grine’s 2001 dataset, the positive correlation between Au. africanus and H. rudolfensis had bootstrap support of only 62%, indicating that the positive correlation was especially sensitive to changes in the character states used to calculate baraminic distances. Likewise, the bootstrap support for the africanus/rudolfensis correlation in Strait and Grine’s 2004 dataset was 59%. In the case of Smith and Grine’s (2008) dataset, reduction of the number of outgroup taxa eliminated all positive correlation between Au. africanus and homininans. In BDC analysis of the Strait, Grine, and Moniz (1997) and Berger et al. (2010) datasets, no positive or negative correlation was observed between Au. africanus and homininans. Zeitoun’s (2000) dataset showed significant, negative BDC between the Au. africanus specimen Sterkfontein 5 and most of the homininan specimens. In summary, the evidence for including Au. africanus within the human holobaramin appears quite weak.
The human holobaramin here described includes only the species or specimens included in the datasets, namely H. sapiens, H. erectus, H. ergaster, H. rudolfensis, H. habilis, H. neanderthalensis, “Au.” sediba, and H. heidelbergensis (included as Broken Hill 1 in the Zeitoun [2000] dataset). Additional taxa of interest include the Dmanisi hominids (Gabunia et al. 2000), the Indonesian Homo floresiensis (Brown et al. 2004), and the European Homo antecessor (Bermúdez de Castro et al. 1997). The Dmanisi hominids are referred to H. erectus by Rightmire and Lordkipanidze (2009) and treated as such in Smith and Grine’s (2008) dataset, although Hartwig-Scherer (2002a) did not accept them as erectus. Argue et al. (2009) included the Dmanisi specimens in their dataset as a separate taxon, but the BDC and MDS results were inconclusive. At this point, the precise status of the Dmanisi hominids will have to await further analysis.
Homo floresiensis was also included in the inconclusive Argue et al. (2009) dataset. Their cladistic analysis would seem to place H. floresiensis among the homininans, although bootstrap support was exceptionally poor. Creationist opinion on H. floresiensis differs. Hartwig-Scherer (2005) and Wise (2005) consider it a legitimate human species, but Line (2006) believes that it was a microcephalic H. sapiens. This debate also continues among professional paleoanthropologists (for example, Argue et al 2006; Gordon et al.; 2008; Obendorf, Oxnard, and Kefford 2008; Richards 2006), but it is immaterial to the question of whether H. floresiensis is human, which creationists agree that it is.
Homo antecessor is little-noted by creationists. It was initially described as a potential ancestor of H. sapiens and H. neanderthalensis (Bermúdez de Castro et al. 1997), and Hartwig-Scherer (2002b) suggested that H. antecessor was a member of the human basic type (that is, monobaramin).
Though the present research unequivocally groups H. habilis, H. rudolfensis, and “Au.” sediba with other species of Homo, this should certainly not be considered definitive. The present study has several drawbacks. First, although holobaramins are supposed to be defined from “holistic” data, all of the datasets used in this study contain only craniodental data. Second, like all fossil datasets, many of the character states are unknown. Since baraminic distances can only be calculated based on known states, unknown states require elimination of taxa, characters, or both. Third and most serious, the criteria for selecting characters informative for baraminology remain unknown. This is especially significant in this study, since two of the datasets analyzed were uninformative, despite being comprised of craniodental characters like the baraminologically informative datasets.
The lack of postcranial information in this study is especially important, since one of Hartwig-Scherer’s (1998) objections to including H. habilis in the human basic type (= monobaramin) is the ape-like nature of the habilis skeleton OH 62. It is possible that inclusion of postcranial characters in future baraminological analyses might support the separation of H. habilis and “Au.” sediba from the human holobaramin. Since postcranial and craniodental characters would be more holistic than craniodental characters alone, any study that included postcranial characters would be preferred to the present study. Alternatively, including “Au.” sediba and Homo habilis in the human holobaramin would suggest that the mosaic nature of australopith anatomy noted by creationists (for example, Hartwig-Scherer 1999; Wise 1994) may not be uniquely diagnostic of that group.
Echoing Hummer’s (1977) earlier call for caution regarding KNM-ER 1470, Mehlert (1999) and Hartwig-Scherer and Brandt (2007) rejected the human status of H. rudolfensis because newer reconstructions of the skull suggested more affinities with Australopithecus than with Homo. Even evolutionary anthropologists Wood and Collard (1999, 2001; Collard and Wood 2007) argued that rudolfensis and habilis should be excluded from the genus Homo (though it should be noted that Wood and Lonergan [2008] continue to refer to Homo rudolfensis and Homo habilis). Furthermore, in their description of KNM-WT 40000 (Kenyanthropus platyops), Leakey et al. (2001) proposed that affinities between KNM-WT 40000 and KNM-ER 1470 might warrant classification of rudolfensis in the genus Kenyanthropus. Cela-Conde and Ayala (2003) recognize the similarities between K. platyops and H. rudolfensis but propose to resolve the question of generic classification by placing K. platyops in Homo. Unfortunately, the relationship of K. platyops to H. rudolfensis cannot be resolved with the present results. Although K. platyops was included in three datasets in the present study (Prat 2004; Smith and Grine 2008; Strait and Grine 2004), it was eliminated from all three because most of its character states were unknown (86.4% missing in Strait and Grine’s 2004 dataset, 72.4% missing in Smith and Grine’s dataset, and 62.3% missing in Prat’s dataset). As noted above, this is an unavoidable shortcoming of working with highly fragmentary fossils. In their published cladistic analyses, however, Strait and Grine (2004) and Smith and Grine (2008) found no evidence of affinity between Kenyanthropus and H. rudolfensis. Regardless of its relationship to Kenyanthropus, however, the present BDC and MDS analyses support including H. rudolfensis in the human holobaramin. Perhaps this assessment will change in the future if additional specimens of Kenyanthropus or postcranial remains of H. rudolfensis are discovered.
Australopithecus
Though there is disagreement among creationists over which members of Homo are truly human, there is unanimity that Australopithecus is not human (for example, Bowden 1981, p. 176; Cuozzo 1998, p. 101; DuBois 1988; Duffett 1983; Frair 1988; Gish 1995, p. 279; Hartwig-Scherer 1999; Line 2005b; Lubenow 2004, p. 301; Mehlert 1980; Murdock 2006; Wise 1994). There is no unanimity on what the australopiths really are. Hartwig-Scherer (1998) placed Australopithecus in a basic type separate from humans and from an extant ape basic type consisting of gorillas, chimpanzees, and bonobos. Wise (1994) would presumably agree, noting that Ardipithecus ramidus is likely “an ancestor of the group of apes called Australopithecines.” Murdock (2006) presents a different perspective, implying that modern chimpanzees are related to australopiths, an assessment that Young (2006) apparently shares. Line (2005b) states no firm opinion on the baraminic status of the australopiths.
Conventional paleoanthropologists similarly disagree on the relationships of the australopiths. Based on their cladistic analysis, Strait, Grine, and Moniz (1997), recommended dividing Australopithecus sensu lato into at least three genera. They classified the robust australopiths, boisei, robustus, and aethiopicus, into the genus Paranthropus and reclassified Australopithecus afarensis as Praeanthropus africanus. In their later analysis, Strait and Grine (2004) found that Au. anamensis and Au. garhi did not form a clade with either Au. africanus nor Pr. africanus. They recommended that anamensis and garhi be transferred to different genera but suggested no generic names. Wood and Collard (1999) initially accepted the Pr. africanus classification, but the name Australopithecus afarensis continues to be used by paleoanthropologists (for example, Lovejoy et al. 2009) and even by Wood himself (Wood and Lonergan 2008).
The BDC and MDS results presented here confirm that the taxa traditionally associated with Australopithecus sensu lato form a diverse group. Based on BDC results alone, the Paranthropus species appear to be a holobaramin, but the MDS results imply that there may be a separation between P. robustus/boisei and P. aethiopicus. Likewise, there is little evidence of affinity between Au. africanus and Au. afarensis. BDC analyses of the datasets of Berger et al. (2010), Smith and Grine (2008), Strait, Grine, and Moniz (1997), and Strait and Grine (2001) revealed positive correlation between chimpanzee and Au. afarensis, but Au. africanus is never correlated with Au. afarensis.
Taken together these results imply that Hartwig- Scherer’s (1998) basic type Australopithecus should be divided into at least three groups. The robust australopiths (genus Paranthropus) can be provisionally classified as one holobaramin, and Au. africanus comprises a second potential holobaramin. Au. afarensis and Au. garhi appear to be part of Hartwig-Scherer’s basic type “Gorillinae,” which includes chimpanzees, bonobos, and gorillas. This too appears to be a holobaramin. It is likely that future studies could reveal additional members of any of these holobaramins, especially Ardipithecus ramidus, Australopithecus anamensis, Kenyanthropus platyops, Orrorin tugenensis, or Sahelanthropus tchadensis. Based on Strait and Grine’s (2004) cladistic analysis, K. platyops could belong to either the Pan/Gorilla/Au. afarensis holobaramin or the Paranthropus holobaramin, and Au. anamensis could belong to the Au. afarensis or Au. africanus holobaramins. Alternatively, these taxa could unite all australopith holobaramins into a single holobaramin. At present however, the fragmentary nature of the fossils of Au. anamensis and K. platyops prevents any meaningful BDC or MDS analysis. A summary of proposed holobaramins is given in Table 3.
Table 3. Summary of proposed holobaramins.
| Name | Taxa | Possible additional taxa |
|---|---|---|
| Human (subtribe Hominina, genus Homo) | H. sapiens, H. neanderthalensis, H. heidelbergensis, H. erectus, H. ergaster, H. habilis, H. rudolfensis, “Au.” sediba | H. floresiensis, H. antecessor, Dmanisi hominid |
| Paranthropus | P. boisei, P. robustus, P. aethiopicus | Kenyanthropus platyops? |
| Australopith #1 | Au. africanus | Kenyanthropus platyops? |
| Australopith #2 | Pan troglodytes, Pan paniscus, Gorilla gorilla, Au. afarensis, Au. garhi, S. tchadensis | Pongo pygmaeus, Ar. ramidus, Au. anamensis |
Biblical and Cultural Context
A full review of the development of human holobaramin is beyond the scope of this paper, but a few contextual details can be noted. First, the extinct human taxa are entirely post-Flood (Snelling 2009, chap. 94; Whitmore and Garner 2008; Wise 2005). They do not represent pre-Flood populations buried during the Flood. Wise (1994; 2008) noted that the account of the Tower of Babel implies that humans distributed globally after the animals. This suggests that human fossils should occur stratigraphically higher than at least some ape fossils (such as australopiths).
Second, the placement of at least eight species (and possibly three others) within the human holobaramin broadens our understanding of “humanity.” It will no longer be possible to simply relegate a fossil form to Homo sapiens, as in the traditional creationist treatment of Neanderthals (for example, Custance 1968; Gish 1995, p. 305; Huse 2000, p. 138), in order to argue that a fossil is either human or ape. Additionally, the diversity of the human holobaramin indicates that humans also experienced post-Flood, intrabaraminic diversification, as hypothesized for animals and plants. The diversity of human species could represent a post-Babel diversification event or diversification of the Babel population prior to human dispersal.
Third, the dispersal of the human population from Babel would presumably have been led by H. habilis and H. rudolfensis, specimens of which appear stratigraphically lower than any other human species. Specimens of both of these species (and of “Au.” sediba) are known only from Africa, whereas the erectus-like species (H. erectus sensu stricto, H. ergaster, and the Dmanisi hominids) are the next stratigraphically and the first human species to disperse across the Old World. Global distribution was achieved only by Homo sapiens, the stratigraphically-highest of the major human species (see Wood and Lonergan [2008] for conventional dating and geographic occurrence of hominin fossils). Any model of post-Babel distribution must account for the appearance and disappearance of these human species in stratigraphic order.
Fourth, DNA sequences from Neanderthal specimens reveal that they are genetically distinct from modern humans (for example, Briggs et al. 2009; Caramelli et al. 2006; Krause et al. 2007; Krings et al. 1997, 1999, 2002; Noonan et al. 2006; Schmitz et al. 2002), even when rate variation is taken into account (Gutiérrez, Sánchez, and Marín 2002) and when compared with Cro-Magnon ancient DNA (Caramelli et al. 2008). This suggests that explanations of Neanderthal morphology as the result of disease (Acton 1978), environmental factors (for example, Lubenow 2004, pp. 264–265), or extreme longevity (Cuozzo 1998) are incorrect. Likewise, any attempt to reconstruct biblical Eve’s original mtDNA sequence (for example, Carter, Criswell, and Sanford 2008) would require consideration of all human species with known sequences.
Outstanding Issues
The discontinuity here demonstrated between Homo sensu lato (including “Au.” sediba) and nonhuman primates confirms the creationist prediction that humans and apes are separate created kinds. Nevertheless, many questions remain unanswered. Resolution of the status of several key taxa (Au. anamensis, Ar. ramidus, Kenyanthropus) is unknown at present and may have to await discovery of additional and more complete specimens. The use of only cranial information in the present study warrants a look at postcranial data where available, especially in light of the importance of postcranial data to other creationist interpretations of Australopithecus sensu lato and H. habilis (for example Hartwig-Scherer 1998; Mehlert 1996; Young 2006).
In addition, the pressing need to understand character selection (for example, Wood 2008a) has only been magnified by this study. Of the eight datasets analyzed in the present study, two (Argue et al. 2009; Prat 2004) yielded BDC and MDS patterns that were uninformative. In Wood’s (2009) survey of 73 published BDC and MDS studies, 28 were classified as having “uncertain” results. In that light, the datasets evaluated here fared slightly better (25% uncertain versus 38.4%), but the central question of what makes a “good” BDC/MDS dataset remains unanswered. One might argue that since this question of character selection is unresolved, any conclusions based on BDC or MDS cannot be trusted. Such a conclusion would be hasty at best. At the very least the use of a suite of characters to define “human” should be preferred to systems that reduce humanness to cranial capacity, limb proportions, or bipedality.
Finally, despite the morphological discontinuity demonstrated here, the genetic similarity between humans and nonhumans is astonishingly high (Wood 2006) and the australopiths are surprisingly human in their appearance. Why should this be? It would be easy to attribute their similarities to a common designer, but such an attribution would be trivial. Certainly the similarities arise from a common source, but what distinguishes a common designer from a common ancestor? As Darwin (1859) wrote in Origin,
Nothing can be more hopeless than to attempt to explain this similarity of pattern in members of the same class, by utility or by the doctrine of final causes . . . . On the ordinary view of the independent creation of each being, we can only say that so it is;—that it has so pleased the Creator to construct each animal and plant (p. 435).
All the foregoing rules and aids and difficulties in classification are explained, if I do not greatly deceive myself, on the view that the natural system is founded on descent with modification; that the characters which naturalists consider as showing true affinity between any two or more species, are those which have been inherited from a common parent, and, in so far, all true classification is genealogical; that community of descent is the hidden bond which naturalists have been unconsciously seeking, and not some unknown plan of creation, or the enunciation of general propositions, and the mere putting together and separating objects more or less alike (p. 420).
To answer this challenge specifically with humanlike animals (or ape-like humans) in mind, we must develop a new understanding of biological similarity, one that embraces common design and creation but that also explains the meaning of the similarities, which admittedly is a theological problem as much as a scientific one.
In the meantime, though, this present study should end charges against creationists that classification of australopiths or “early Homo” as human or ape is arbitrary and meaningless (for example, Conrad 1986–1987; Kitcher 1983, p. 154; Miller 2008, p. 93; Nickels 1986–1987). Rather than looking at a handful of traits or casually declaring australopiths to be apes, the present study has supported the separate classification of humans (genus Homo sensu lato) and as many as three groups containing australopith taxa, based on a suite of characters selected from conventional paleoanthropology studies.