The views expressed in this paper are those of the writer(s) and are not necessarily those of the ARJ Editor or Answers in Genesis.
Abstract
Precipitation from two cold, winter orographic storms during February 2005 and April 2006 in Yosemite National Park and the Sierra Nevada was simulated with the NCAR mesoscale weather model called WRF (Weather Research and Forecasting model). The sea-surface temperature of the Pacific Ocean upwind of the mountains was prescribed with six different fixed temperatures and the resulting simulated precipitation compared to the actual storm precipitation. Warm sea-surface temperatures increased the precipitation above normal by a factor of about six. Based on the likely increase in precipitation rate and frequency of storms following the Genesis Flood, glaciers thousands of feet thick would have easily developed in a few hundred years following the Genesis Flood.
Keywords: precipitation, Yosemite National Park, Sierra Nevada, winter orographic, Weather Research and Forecasting Model, WRF, NCAR, sea-surface temperature, SST, glaciers, Genesis Flood, deep upper low, Rex Blocking Pattern.
Introduction
Vardiman (2008) proposed that a series of numerical simulations of precipitation be conducted in Yosemite National Park to determine if a warm Pacific Ocean heated by the Genesis Flood could explain the occurrence of glaciers for the Sierra Nevada in a young-earth time frame. He suggested that a conventional mesoscale meteorology model available from the National Center for Atmospheric Research (NCAR 2007) be used to simulate precipitation for several types of storms at multiple sea-surface temperatures (SSTs). The first simulation to be completed was a warm storm with a long, steady fetch over the Pacific Ocean from near Hawaii called the Pineapple Express. Vardiman and Brewer (2010) reported that warm sea-surface temperatures in the Pacific Ocean for this warm storm would have increased the precipitation rate by as much as a factor of four and likely contributed to massive glacial growth in Yosemite National Park. The two case studies to be reported here—A Deep Upper Low and Rex Block cases—are examples of two additional types of storms which migrate across the Pacific Ocean into California from the west or the northwest and are characteristically cold storms.
General Storm Summaries and Weather Synposes
Deep Upper Low storm (April 2–6, 2006)
The Deep Upper Low storm (DUL) is one class of storm which affects the West Coast of the U.S. typically in the winter and spring. A semi permanent high pressure ridge develops in the Gulf of Alaska and a high amplitude trough of low pressure forms directly east of the ridge but off the West Coast of the United States. Short waves and associated surface lows travel along the upper level jet stream diving down the West Coast as far south as 20–30° north. Short waves are traveling pressure waves in the midlevels of the troposphere with typical wavelengths of less than 1,000 km (621 miles) which are responsible for most day-to-day weather in mid-latitudes. These rapidly moving storms draw cold air from Alaska southward to meet warm, moist air in the subtropical jet stream which is frequently positioned over southern California and northern Mexico. The storms rotate around the trough off the coast of California and travel northeastward across the Sierra Nevada bringing heavy snow to the high country and rain to lower elevations. The heavy precipitation event of April 2–6, 2006, was such a Deep Upper Low storm. A synopsis of this storm was published by Kozlowski and Ekern (2006) of the National Weather Service.
A rather persistent weather pattern for the month of March brought a prolonged period of above normal precipitation and below normal temperatures to northern and central California. A series of storms originated in the Gulf of Alaska and dove southeastward toward the California coast before shifting inland. Cool temperatures accompanied these systems, bringing snow to elevations that usually do not experience an abundance of “winter-like” weather. Also, in the central Pacific the highly amplified wave pattern of the jet stream produced a strong Kona low just west of the Hawaiian Islands. Kona lows are subtropical cyclones that occur during the cool season in the north central Pacific. The Hawaiian word, Kona, means leeward and is used to describe winds with a southerly component that replace the usually persistent trade wind regime from the northeast. Historically Kona lows have produced a variety of weather-related hazards in Hawaii, including heavy rains, hailstorms, flash floods, landslides, high winds, large surf and swell, waterspouts, and severe thunderstorms.
As March turned to April, the Deep Upper Low storm (April 2–6, 2006) developed in the Gulf of Alaska and began to dive south and east toward the West Coast. While this system was part of the overall pattern now in place for over a month, what set this storm apart from the others was the influx of deep moisture from the lower latitudes. The schematic displayed below in Fig. 1 depicts the synoptic pattern of the heavy precipitation event that occurred from April 2–6, 2006. First, an unseasonably deep upper low spun out of the Gulf of Alaska and settled slowly south along 130W. The highly amplified polar jet stream resulted in the slow progression of this system through the region, and a prolonged period of precipitation over the San Joaquin Valley and southern Sierra Nevada. The 500 mb height anomalies for the April 2–6, 2006 time period showed this highly amplified and unseasonable pattern.
Two distinct moisture sources were evident with this system. The first and less moisture-laden air mass located between 30N and 40N rotated around the base of the upper low before advecting across northern and central California. The second and more subtropical airmass originated from even lower latitudes, being drawn northward from a rather persistent “Kona” low situated just north and west of the islands for much of the month of March. This resulted in extensive flooding across the state of Hawaii, where numerous problems were reported. This was especially true on the islands of Kauai and Oahu. On March 14, the Ka Loko reservoir (located on northeast Kauai) failed, sending a flood wave downstream toward the town of Kilauea. Homes and other buildings in the path of the water were destroyed, but more tragic were the deaths of several individuals. A portion of this warm, moist air mass just to the east of the Hawaiian Islands advected northeast toward central and southern California “on the back” of the subtropical jet stream aimed at southern California and northern Baja. These two moisture sources merged off the West Coast, and advected over the region with precipitable water values recorded between 25 mm and 32 mm (1.00 and 1.25 inches). Precipitable water (measured in millimeters or inches) is the amount of water in a column of the atmosphere. The precipitable water value is the depth that would be achieved if all the water in that column were precipitated as rain.
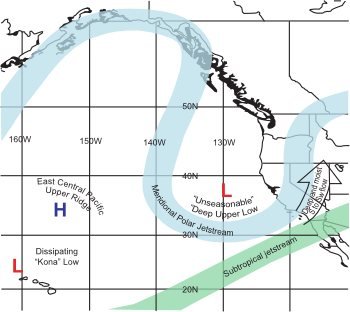
Fig. 1. General weather pattern for Deep Upper Low affecting the East Pacific and the West Coast of the United States for April 2–6, 2006.
With south to southwest flow extending through most of the lower troposphere pumping a warm, moist air mass over the region, snow levels jumped to 3,048 m (10,000 feet) over the southern Sierra Nevada. Also, efficient warm rain processes brought moderate to heavy amounts of precipitation during the 96-hour period ending April 6, 2006, at 5 a.m. PDT. A warm rain process is one in which rain at the ground is primarily produced by the collision of cloud and rain droplets without freezing and melting of ice crystals. This unseasonably deep upper low finally began to shift inland as another potent system began to dive south and east out of the Gulf of Alaska. With the system moving directly overhead, heavy showers and thunderstorms developed in the unstable air mass giving the region one last shot of precipitation. As previously mentioned, the next upstream system did generate some fears of exacerbating the flooding problems across the San Joaquin Valley and adjacent southern Sierra Nevada as the brunt of this storm originally looked to take aim on these already wet basins. Fortunately, a slight deviation in the system’s path resulted in the band of heaviest precipitation from the San Francisco Bay area northeast over the Shasta Lake drainage and northern Sierra Nevada. This storm resulted in a rise on the Russian River while also creating a renewed rise on the Sacramento River system. Also, inflows into reservoirs across northern California increased as well.
Rex Blocking Pattern storm (February 17–23, 2005)
The Rex Blocking Pattern (RBP) is another class of storm, similar to the Deep Upper Low storm, except the pressure ridge is farther east and north. It often results in drought conditions for the West Coast, particularly in the fall. The main storm track for a Rex Blocking Pattern storm flows from the Gulf of Alaska into Canada and down into Montana completely missing the West Coast. However, as short waves move through the ridge, a secondary low pressure center and counterclockwise circulation pattern may be established over the California coast which draws on the moisture in the sub-tropical jet stream over Mexico. A persistent small-scale jet stream is established which draws energy from the short wave and produces an orographic flow (horizontal air lifted by a mountain barrier) over the Sierra Nevada. Because of its persistence large quantities of precipitation can occur in southern California while the remainder of the West Coast to the north remains relatively dry. A synopsis of this storm was published by Kozlowski and Ekern (2005) of the National Weather Service.
A stubborn pattern, situated across the eastern Pacific and West Coast of North America for more than a week, brought periods of precipitation to southern California from February 17–23, 2005. This pattern, known as a “Rex Block,” occurs when an upper high pressure system sets up at a northerly latitude while an upper low pressure system sets up at a more southerly latitude along a similar longitude line. In this case, the upper high pressure system parked itself off the British Columbia coast, which in turn pushed the dry polar jet stream well into Alaska and northern Canada. The initial upper low pressure system anchored near 130W and just off the central California coast. The moist subtropical jet stream (which played a key role in a January 7–11, 2005, southern California heavy precipitation event) did not play much of a factor in this event. It remained for the most part along 20N before steering northeast into the south-central United States and northern Mexico. As a result, atmospheric moisture content during these series of precipitation events generally peaked near 25 mm (1 inch) of precipitable water.
Rounds of precipitation affected southern California from Santa Barbara to San Diego counties on Friday February 18 and again on Saturday, February 19. This precipitation was enhanced by shortwave energy rotating around the initial upper low pressure system, upper jetstreaks (limited regions of highspeed winds) sliding around the base of the low nosing into southern California, and increasing lowlevel flow from the south to southwest slamming into the adjacent coastal mountain ranges (see Fig. 2).
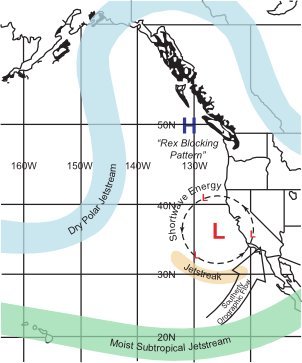
Fig. 2. General weather pattern for the Rex Blocking Pattern case affecting Southern California for February 17–23, 2005.
This initial upper low pressure system began to weaken on Saturday morning, February 19 and moved slowly off to the northeast. However, strong short wave energy from the central Pacific and a cold origin upper low pressure system diving south-southwest out of western Canada reinforced the blocking pattern on Sunday afternoon, February 20. This developed a second and stronger upper low pressure system inside 130W just off the central California coast.
With this second upper low pressure system in place Sunday night, February 20, the strongest short wave energy for the entire event took aim at southern California. Although moisture content (precipitable water values near 25 mm [1 inch]) and southerly flow ahead of the short wave energy were similar when compared to the previous few days, the impressive dynamics increased precipitation rates (and precipitation totals) across the entire region, reaching near 25 mm (1 inch) per hour. Infrared satellite imagery loops on Sunday, February 20 clearly showed the dynamics associated with this system as it developed into a classic comma-shaped pattern and cloud tops cooling rapidly to as low as -55°C. A loop of Nexrad WSR-88D radar 0.5° reflectivity imagery displayed the precipitation echoes associated with this frontal cloud band and the continuous regeneration of precipitation streaming northward into the mountain ranges which were transverse to the wake of the cold front.
After this strong short wave exited the region to the north and east, the upper low pressure system very slowly began to move off to the east-southeast. However, additional periods of precipitation continued through the Presidents’ Day holiday (Monday, February 21) into the middle of the week as additional short wave energy rotated through southern California.
The potential for convective precipitation remained a concern throughout the duration of the event. The close proximity to the upper low pressure system, favorable dynamics, and afternoon heating from breaks in the cloud cover produced scattered thunderstorms every afternoon; even a few waterspouts and weak tornadoes that affected coastal areas from Santa Barbara to San Diego counties. Sounding data from Vandenberg and San Diego showed the destabilized atmosphere in place across the region, indicative of the development of thunderstorms. In fact, this convective weather moved as far north as the Sacramento Valley in northern California on Monday, February 21, where weak tornadoes also touched down in the greater Sacramento area near the international airport. Finally by the end of the week, the blocking pattern in the eastern Pacific and western North America pushed inland into the intermountain West and weakened.
Sea-Surface Temperature
Fig. 3 shows the distribution of sea-surface temperature over the eastern Pacific Ocean during the Deep Upper Low (DUL) case. The sea-surface temperature of the purple and yellow regions over which the air flowed before reaching the West Coast for the actual case averaged between about 10–20°C. As the air moved over the ridge in the Gulf of Alaska it moved over cold water of about 10°C and then swept southward over warmer water of about 20°C before crossing the West Coast into the Sierra Nevada. Depending upon the north/south position of the individual storms entering Yosemite National Park, the air ahead of a front within the storm was relatively warm, and behind the front the air was dramatically colder. The sea-surface temperature was colder close to the coastline because of the clockwise ocean circulation in the Pacific gyre which brings southward some of the colder 10°C water in Gulf of Alaska.
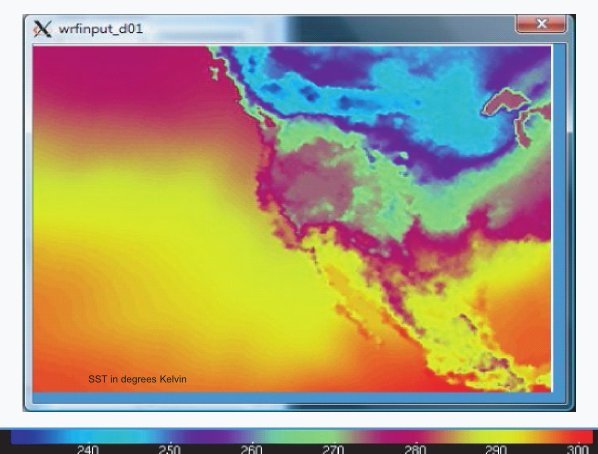
Fig. 3. Distribution of sea-surface temperature in the eastern Pacific Ocean for the Deep Upper Low case. Temperatures on color bar are in degrees kelvin. To convert to degrees centigrade, subtract 273.
Fig. 4 shows the distribution of sea-surface temperature over the eastern Pacific Ocean during the Rex Blocking Pattern (RBP) case. The sea-surface temperature of the purple and green regions over which the air flowed before reaching the West Coast for the actual case averaged between about 10–20°C. As the air moved northward on the west side of the ridge in the eastern Pacific it moved over warm water of about 20°C and then over colder water of about 10°C before entering Canada and the upper United States. However, because this type of storm induces a circulation off the West Coast of California which affects Yosemite National Park, the more important seasurface temperature is that directly off the California Coast. Here the temperature was typically about 20°C and the variation of temperatures in the storm ahead of and behind the fronts were less pronounced than for the Deep Upper Low (DUL) case.
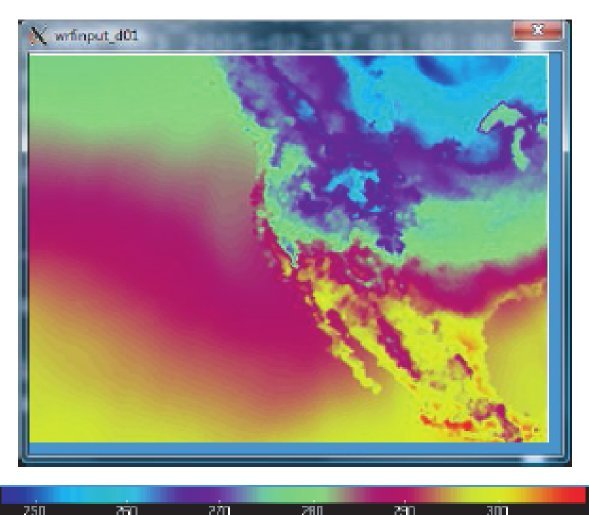
Fig. 4. Distribution of sea-surface temperature in the eastern Pacific Ocean for the Rex Blocking Pattern case. Temperatures on color bar are in degrees kelvin. To convert to degrees centigrade, subtract 273. Note: the color code in this figure is slightly different than in Fig. 3.
Precipitation
The Deep Upper Low (DUL) case
A significant precipitation event at the beginning of 2006 brought widespread flooding to parts of southwest Oregon, northern California, and western Nevada. A relatively quiet period of weather then developed across the entire region. However, a shift in the weather pattern toward cooler and wetter weather took place at the end of February. A series of systems developed in the Gulf of Alaska and tracked southeast toward northern and central California. This pattern remained rather persistent for nearly a month and a half, bringing above normal precipitation and below normal temperatures to the region.
Fig. 4 shows the distribution of sea-surface Storm after storm affected northern and central California during the month of March with very few breaks, allowing precipitation totals to finish well above normal. In Sacramento, the record for the number of days with at least .25 mm (.01 inch) of precipitation was broken as the city received 14 mm (0.55 inch) on the last day of March. The new record of 20 days broke the old record of 19 days last set in the year 1989. Also, given the cold origin of the March storms, a snowpack that was measured near normal on March 1 jumped to near 150% by the middle of April. In fact, the snow depth at Blue Canyon (elevation 1,609 m [5,280 feet] along Interstate 80) measured just 13 cm (5 inches) on March 1, peaked near 190 cm (75 inches) around the middle of the month, and ended up near 170 cm (67 inches) on April 1. To better illustrate the storm track across northern and central California during the month of March, Table 1 shows a comparison to monthly totals at major cities along the West Coast.
| March Precipitation–West Coast Cities | ||||
|---|---|---|---|---|
| Location | March 2006 precipitation (mm) | March average (mm) | Departure (mm) | Percent of normal |
| Seattle | 55.4 | 95.2 | -39.8 | 58 |
| Portland | 75.2 | 94.2 | -19.0 | 80 |
| Sacramento | 153.0 | 80.0 | +73.0 | 191 |
| Fresno | 120.0 | 55.9 | +64.1 | 215 |
| Los Angeles | 72.9 | 79.8 | -6.9 | 91 |
| San Diego | 34.5 | 57.4 | -22.9 | 60 |
Starting on April 2 and lasting through April 6, another cold system dropped out of the Gulf of Alaska and took aim at the West Coast. This storm was stronger and moved farther south along the coast as compared to other systems that affected the region in March. This allowed the system to tap into a warmer air mass with a higher moisture content before advecting over central and southern California. Warm rain processes resulted in efficient precipitation production and increased storm totals. Finally, the extremely slow progression of this system through the area allowed precipitation to focus on the San Joaquin Valley and adjacent Sierra Nevada foothills and mountains for a prolonged period of time. Tables 2 and 3 depict storm total precipitation amounts for the 96-hour period starting April 2, 2006, at 5 a.m. PDT and ending April 6, 2006, at 5 a.m. PDT, while also providing a comparison to the monthly April average (1971–2000) for several locations in the San Joaquin Valley and the southern Sierra Nevada.
| San Joaquin Valley Precipitation | |||
|---|---|---|---|
| Location | April 2–6, 2006 (mm) | April Average (1971–2000) (mm) | Percent of normal |
| Stockton | 42.9 | 26.2 | 164 |
| Modesto | 42.9 | 24.9 | 172 |
| Merced | 49.3 | 24.9 | 198 |
| Fresno | 48.5 | 22.4 | 217 |
| Southern Sierra Nevada Precipitation | |||
|---|---|---|---|
| Location | April 2–6, 2006 (mm) | April Average (1971–2000) (mm) | Percent of normal |
| Calaveras | 173.0 | 415.0 | 168 |
| Yosemite | 125.0 | 70.4 | 177 |
| Huntington Lake | 178.0 | 93.0 | 191 |
| Giant Forest | 152.0 | 121.0* | 126 |
| * Note: Giant Forest April average is from 1931–1968. | |||
Fig. 5 shows the total 96-hour storm precipitation of April 2–6, 2006, over southern California. Note that in the Deep Upper Low (DUL) case the mountain precipitation averaged about 15 cm (6 inches) and the valley precipitation averaged almost 5 cm (2 inches). This ratio of 6 to 2 between the mountain and valley precipitation is less than frequently observed for more orographic-type storms. In this case the precipitation was driven more by the dynamics of the frontal boundaries than by uplift over the mountain barrier. When this occurs the precipitation is influenced less by elevation differences.
The Rex Blocking Pattern (RBL) case
During Christmas 2004 through February 2005 much of southern California experienced a prolonged period of precipitation with the area from near Point Conception west of Santa Barbara to the San Gabriel and San Bernardino Mountains north and east of Los Angeles hardest hit. Storm totals generally ranged from 10 cm to 20 cm (4 to 8 inches) across coastal locations, while adjacent mountains received 20 cm to 46 cm (8 to 18 inches). However, localized amounts exceeded the 51 cm (20 inch) mark, including Opids Camp just north of Los Angeles in the San Gabriel Mountains. These precipitation totals, in addition to the two impressive earlier storm systems affecting the region around New Year’s Day and the second week of January, placed many locations well above seasonal normals. Since the water year began on October 1, percentage of normal precipitation across southern California generally ranged from 200 to 400%. Table 4 shows precipitation totals from the three significant storm periods for some key precipitation gages in southern California.
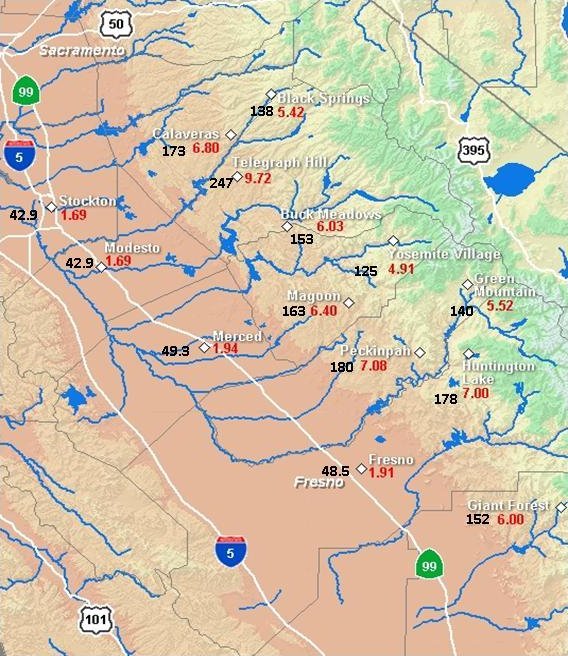
Fig. 5. Total 96-hour storm precipitation over southern California for the Deep Upper Low case of April 2–6, 2006 (after Kozlowski and Ekern 2006). Black units are in mm and red are in inches.
With several significant precipitation events occurring across southern California in 2005, both Downtown Los Angeles (USC Campus) and San Diego (Lindbergh Field) nearly matched their wettest years since records were first recorded. Through March 1, 2005, both locations reached their third wettest year (seasonal totals begin on July 1). The information in Table 5 shows the top three precipitation years, including 2005.
| Gage | December 26– January 5 (mm) | January 7–11 (mm) | February 1–23 (mm) | Totals from all three storms (mm) |
|---|---|---|---|---|
| San Marcos Pass | 461.0 | 625.9 | 301.0 | 1,390.0 |
| Nordhoff Ridge | 416.0 | 711.0 | 350.0 | 1,480.0 |
| Opids Camp | 504.0 | 811.0 | 569.0 | 1,880.0 |
| Palomar Mountain | 216.0 | 322.0 | 209.0 | 749.0 |
Another interesting fact to note was the precipitation deficits across the Pacific Northwest compared with the surpluses across southern California in 2005. Seasonal totals through March 1 at in Los Angeles and San Diego outpaced Seattle and Portland. Table 6 shows the precipitation totals from July 1 to March 1, the departure from normal, and the normal precipitation for these four locations.
Fig. 6 displays the 168-hour precipitation totals for the Rex Blocking Pattern (RBP) case of February 17–24, 2005, for California, most of Nevada, and southern Oregon. Note the particularly heavy precipitation totals to the north and east of Los Angeles and along the coast from San Diego to San Francisco. Even the deserts of Nevada east of the Sierra Nevada experienced heavy precipitation including Las Vegas, Desert Rock, and Kane Springs. The Central Valley of California between Fresno and Sacramento averaged about 25% of the precipitation in the Sierra Nevada to the east.
| Records began | 7/1/1883 to 6/30/1884 (mm) | 7/1/1889 to 6/30/1890 (mm) | 7/1/1940 to 6/30/1941 (mm) | 7/1/2004 to 6/30/2005 (mm) | |
|---|---|---|---|---|---|
| Los Angeles USC Campus | 1877 | 970.0 | 885.0 | 860.0* | |
| San Diego Lindbergh Field | 1850 | 660.0 | 628.0 | 499.0** | |
| *Wettest year in Los Angeles for 115 years **Wettest year in San Diego for 64 years |
|||||
Numerical Simulation of the Deep Upper Low (DUL) and Rex Blocking Pattern (RBP) Cases
Vardiman originally proposed simulating storms in Yosemite using the NCAR Mesoscale Meteorology Model (MM5) (NCAR 2003). However, by the time the project began in the fall of 2008 a new model called the Weather Research and Forecasting Model (WRF) (NCAR 2007) was available with updated capabilities. It is based on similar procedures as MM5 and contains many of the same subroutines. It was decided to use the WRF model for the project rather than the older MM5 model because it has more capabilities and is actively supported.
WRF was installed on the EPIPHANY 44-node parallel processor at the ICR offices in Dallas, Texas in the Fall of 2008. Wes Brewer developed the support software for inputting and storing the data needed for conducting simulations at Yosemite. Topographic data for the Western U.S. and meteorological data for the Pineapple Express (PEX) case were imported into the model. These data were available from NCAR by exercising subroutines within WRF.
| Location | July 1–March 1 (mm) | Normal (mm) | Departure from normal (mm) | Percent of normal |
|---|---|---|---|---|
| Seattle | 558.0 | 697.0 | -139.0 | 80 |
| Portland | 423.0 | 678.0 | -256.0 | 62 |
| Los Angeles | 860.0 | 274.0 | +586.0 | 452 |
| San Diego | 499.0 | 190.0 | +309.0 | 263 |
Fig. 7 shows the three spatial domains which were established for simulations of the Yosemite cases, all centered on Mt. Hoffmann, a 3,307 m (10,850 foot) mountain near the center of Yosemite National Park. The three domains allow simulations to be conducted over progressively larger areas with coarser resolutions. The smallest domain has dimensions about 650 km (404 miles) east/west and 500 km (311 miles) north/south and 3 km (2 miles) grid spacing. The middle domain is three times as large as the inner domain with dimensions about 2,000 km (1,243 miles) east/west and 1,500 km (932 miles) north/ south and a grid spacing of 9 km (5.5 miles). The largest domain is nine times as large as the innermost domain with dimensions about 5,600 km (3,480 miles) east/west and 4,400 km (2,734 miles) north/south and grid spacing of 27 km (17 miles). Total storm precipitation in millimeters is displayed by color. The precipitation shown for a sample case in Fig. 7 varied from 0 to over 720 mm (~28 inches).
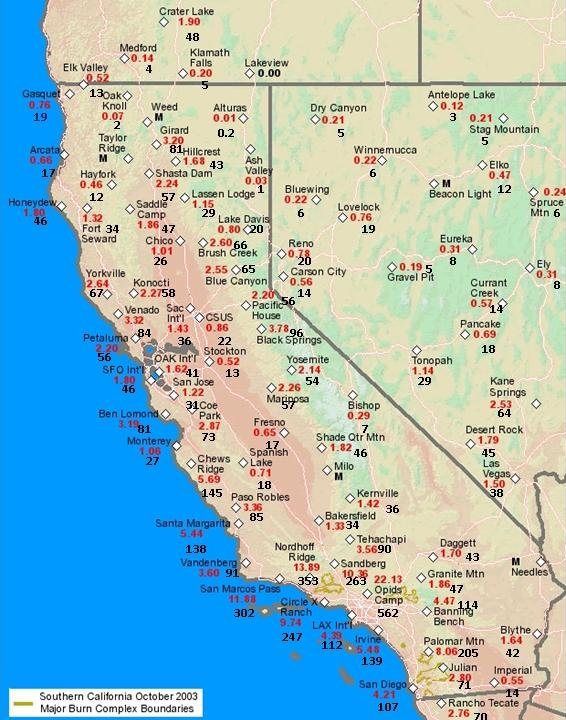
Fig. 6. Total 168-hour storm total precipitation for Rex Blocking Pattern case on February 17–24, 2005 (after Kozlowski and Ekern 2005). Black units are in mm and red are in inches.
Validation of Weather Research and Forecasting Model (WRF) for the Deep Upper Low (DUL) and Rex Blocking Pattern (RBP) Cases
WRF has numerous subroutines and parameters which can be activated and adjusted for various conditions. For example, some of the cloud physics subroutines are appropriate for cold, winter storms and others for warm tropical storms. Turbulence and mixing can be adjusted in the dynamics portion of the model. Various radiation codes are available and boundary conditions can be modified. Normally, these subroutines and parameters are adjusted until the computed precipitation from WRF matches the observed precipitation.
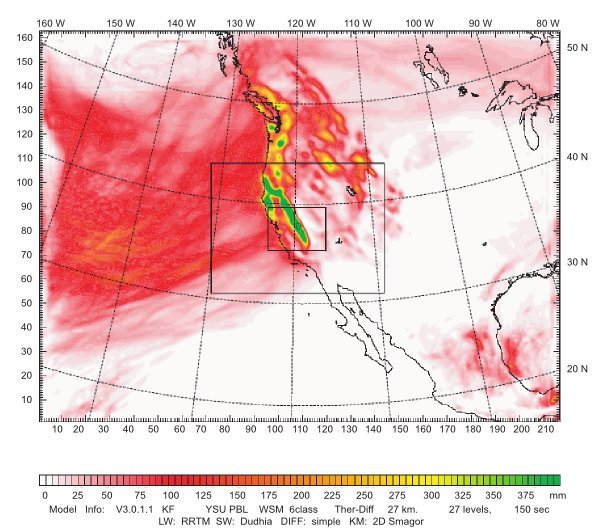
Fig. 7. Three spatial domains established for the simulation of storms in Yosemite National Park. The colored regions represent total storm precipitation in mm. This display is the actual storm accumulation for 8 days of the Pineapple Express case reported in Vardiman and Brewer (2010). East/west and north/south distances are in number of grids with 27 km (17 miles) grid lengths.
The validation method used in the Deep Upper Low and Rex Blocking Pattern case studies was to set the various parameters in the WRF model according to the conditions expected in winter, orographic storms and compare the computed total storm precipitation with the observed total storm precipitation. Figs. 8 and 9 show comparisons between the computed and actual storm total precipitation for the Deep Upper Low and Rex Blocking Pattern cases, respectively. Tables 7 and 8 provide stations identifiers and other information for sites shown on the graph.
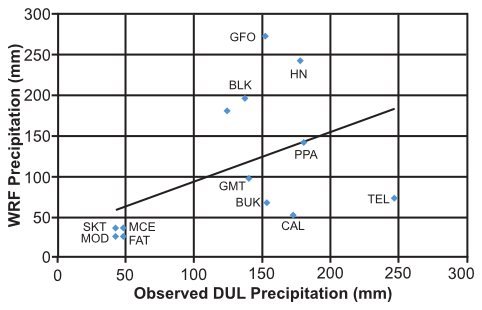
Fig. 8. Comparison of Weather Research and Forecasting Model computed precipitation versus Deep Upper Low total observed storm precipitation.
| Station | Code | Latitude | Longitude | Elevation (m) | Observed Precipitation (mm) | WRF Precipitation (mm) |
|---|---|---|---|---|---|---|
| Stockton | SKT | 38.0° | 121.3° | 8 | 42.9 | 26.2 |
| Modesto | MOD | 37.6° | 121.0° | 22 | 42.9 | 36.4 |
| Merced | MCE | 37.3° | 120.5° | 46 | 49.3 | 36.0 |
| Fresno | FAT | 36.7° | 119.8° | 101 | 48.5 | 25.8 |
| Calaveras | CAL | 38.1° | 120.9° | 1,431 | 172.7 | 51.8 |
| Telegraph | TEL | 38.0° | 120.4° | 1,137 | 246.9 | 73.7 |
| Buck M. | BUK | 37.5° | 120.1° | 919 | 153.2 | 66.9 |
| Peckinpah | PPA | 37.2° | 119.5° | 1,570 | 179.8 | 141.2 |
| G. Forest | GFO | 36.6° | 118.8° | 2,027 | 152.4 | 272.6 |
| B. Spring | BLK | 38.4° | 120.2° | 1,981 | 137.7 | 196.3 |
| Yosemite | YOS | 37.8° | 119.6° | 1,280 | 124.7 | 181.1 |
| Green M. | GMT | 37.6° | 119.2° | 2,408 | 140.2 | 97.1 |
| Huntington | HNT | 37.2° | 119.2° | 2,140 | 177.8 | 242.3 |
The stations in the lower left corner of Fig. 8 are generally in the Sacramento Valley at lower elevations and upwind of the Sierra Nevada. The stations in the upper right hand corner are typically at higher elevations in the mountains, although there are several exceptions. The observed and computed precipitation amounts both tend to increase with altitude, but the relationship is poor. The regression coefficient between computed and observed total storm precipitation was about 0.46. This means that only approximately 21% of the observed precipitation over the Sierra Nevada can be explained by the WRF model.
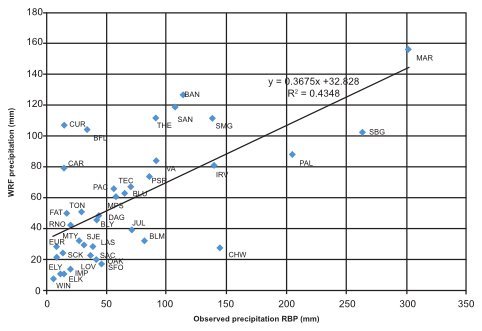
Fig. 9. Comparison of Weather Research and Forecasting Model computed precipitation versus Rex Blocking Pattern total observed storm precipitation.
| Station | Code | Latitude | Longitude | Elevation (m) | Observed Precipitation (mm) | WRF Precipitation (mm) |
|---|---|---|---|---|---|---|
| Blue Can. | BLU | 39.3° | 120.7° | 1,608 | 64.8 | 62.7 |
| Sacramento | SAC | 38.5° | 121.5° | 4.5 | 36.3 | 22.3 |
| Pac. House | PAC | 38.8° | 120.5° | 1,052 | 55.9 | 65.7 |
| San Fran. | SFO | 37.6° | 122.4° | 2.4 | 45.7 | 17.2 |
| Oakland | OAK | 37.7° | 122.2° | 2 | 41.1 | 19.8 |
| Stockton | SCK | 37.9° | 121.2° | 8 | 13.2 | 24.1 |
| San Jose | SJE | 37.4° | 121.9° | 15.5 | 31.0 | 29.4 |
| Mariposa | MPS | 37.5° | 120.0° | 641 | 57.4 | 60.6 |
| Ben Lom. | BLM | 37.1° | 122.1° | 128 | 81.0 | 32.1 |
| Fresno | FAT | 36.8° | 119.7° | 101 | 16.5 | 50.0 |
| Monterey | MTY | 36.6° | 121.8° | 50 | 26.9 | 32.2 |
| Chews R. | CHW | 36.3° | 121.6° | 1,543 | 144.5 | 27.5 |
| Paso Rob. | PSR | 35.7° | 120.6° | 247 | 85.3 | 73.3 |
| S. Marg. | SMG | 34.4° | 120.6° | 335 | 138.2 | 111.1 |
| Bakersfield | BFL | 36.4° | 119.1° | 149 | 33.8 | 103.9 |
| Vandenbrg. | VAN | 34.7° | 120.6° | 116 | 91.4 | 84.2 |
| Tehachapi | THE | 35.1° | 118.4° | 1,207 | 90.4 | 111.5 |
| Sandberg | SBG | 34.8° | 118.7° | 1,375 | 263.1 | 102.3 |
| Daggett | DAG | 34.9° | 116.8° | 600 | 43.2 | 48.4 |
| San Marcos | MAR | 34.5° | 119.8° | 701 | 301.8 | 155.7 |
| Irvine | IRV | 33.7° | 117.7° | 165 | 139.2 | 80.8 |
| Banning | BAN | 33.9° | 116.9° | 676 | 113.5 | 126.3 |
| Palomar | PAL | 33.4° | 116.8° | 1,692 | 204.7 | 87.8 |
| Blythe | BLY | 33.6° | 114.7° | 120 | 41.7 | 45.8 |
| San Diego | SAN | 32.7° | 117.2° | 4.5 | 106.9 | 118.8 |
| Julian | JUL | 33.1° | 116.6° | 1,285 | 71.1 | 39.2 |
| Imperial | IMP | 32.8° | 115.6° | -19.5 | 14.0 | 10.9 |
| Tecate | TEC | 32.6° | 116.7° | 1,186 | 70.1 | 66.9 |
| Winnemuc. | WIN | 40.9° | 117.8° | 1,309 | 5.6 | 7.3 |
| Elko | ELK | 40.8° | 115.8° | 1,533 | 11.9 | 10.6 |
| Lovelock | LOV | 40.1° | 118.6° | 1,189 | 19.3 | 13.8 |
| Reno | RNO | 39.5° | 119.8° | 1,344 | 19.8 | 42.4 |
| Carson C. | CAR | 39.2° | 119.8° | 1,418 | 14.2 | 79.4 |
| Eureka | EUR | 39.6° | 116.0° | 1,809 | 7.9 | 28.4 |
| Ely | ELY | 39.3° | 114.8° | 1,909 | 7.9 | 21.2 |
| Currant C. | CUR | 39.8° | 115.3° | 2,080 | 14.5 | 107.1 |
| Tonopah | TON | 38.1° | 117.1° | 1,644 | 29.0 | 50.7 |
| Las Vegas | LAS | 36.0° | 115.1° | 749 | 38.1 | 28.3 |
This is not a good correlation for precipitation measurements, but is somewhat understandable because of the types of storms that move through the Yosemite region during a Deep Upper Low regime. In addition to the limitations on accurate model prediction for the Pineapple Express case study by Vardiman and Brewer (2010), the Deep Upper Low case exaggerates these problems because of such wide fluctuations in temperature and wind direction before and behind the short waves. Just ahead of the front the surface wind will be strongly out of the south/southeast and the temperature will be relatively warm. Shortly after the cold front passes through the area, the wind will suddenly switch to the west/northwest and the temperature will drop dramatically. Frequently the air will become highly unstable behind the front and convection will break out. Convection is hard to capture accurately in the precipitation gage network because of its small horizontal scale. The correlation between computed and observed precipitation for the Deep Upper Low case study is judged to be poor, at best.
The stations in the lower left corner of Fig. 9 for the Rex Blocking Pattern are generally in the Sacramento Valley at lower elevations upwind of the Sierra Nevada and in the Nevada desert downwind of the mountains. The stations in the upper right hand corner are typically along the southern California coast and at higher elevations in the mountains, although there are many exceptions. The observed and computed precipitation amounts both tend to increase with altitude, but the relationship is not exact. The regression coefficient between computed and observed total storm precipitation was 0.66. This means that approximately 43% of the observed precipitation over the Sierra Nevada was explained by the WRF model.
This is a better correlation for precipitation than the Deep Upper Low correlation, but not as good as the Pineapple Express case study reported in Vardiman and Brewer (2010). Most of the same limitations mentioned for the Pineapple Express and the Deep Upper Low case studies apply here, but not as strongly as for the Deep Upper Low case study. The reason is that the circulation pattern under the Rex Blocking Pattern case causes a counterclockwise circulation directly off the southern California coast which produces a consistent air flow from the south through west. On the other hand, the air flow is not as steady as for the Pineapple Express case. The correlation between computed and observed precipitation for the Deep Upper Low case study is judged to be somewhat weak, but adequate.
Numerical Simulation of Precipitation for Six Sea-Surface Temperatures
The Deep Upper Low storm and the Rex Blocking Pattern storms were simulated with the WRF model for six different sea-surface temperatures for the Eastern Pacific Ocean (0°C, 10°C, 20°C, 30°C, 40°C, and 45°C). The purpose was to determine the effect of sea-surface temperature on total storm precipitation in Yosemite National Park and the surrounding areas. An attempt was made to complete a simulation at 50°C as well, but WRF became unstable and would not complete a run at that temperature even using a very small timestep which creates long run times. The maximum sea-surface temperature possible was at 45°C, for consistent results with moderate time steps and run times. When running models such as WRF, the parameters are usually adjusted to work well within the range of normally observed temperatures. When sea-surface temperature rises to 30°C or above, the parameters of the model may not be adjusted to such hot temperatures and, therefore, one can get spurious results. But this probably did not happen, at least for sea-surface temperatures less than or equal to 40°, as the results seem logical and as expected with such hot sea-surface temperatures.
The total precipitation for the smallest domain of the Deep Upper Low storm is shown in Figs. 10–15 and for the Rex Blocking Pattern storm in Figs. 16–21 for sea-surface temperatures from 0°C to 45°C. The Pacific Ocean upwind of the California coast was maintained at a constant sea-surface temperature throughout each of the simulations. Note, in Figs. 10–21, the California coastline is shown in the lower left-hand corner of the diagram, the 120° west longitude line (the northeastern border of California) is shown as a dashed, vertical line near the middle, Lake Tahoe is near the top center, and the boundary of Yosemite National Park is shown to the right of the vertical dashed line near the center of the plot.
The size scales of the diagrams are shown in kilometers (km) along the horizontal and vertical axes. The coastal range parallels the California coast about 24 km (15 miles) inland and varies in elevation from a few hundred feet to a few thousand feet in Southern California. The Sierra Nevada also parallels the California coast, but is located about 80 km (50 miles) inland and varies in elevation from less than 1,219 m (4,000 feet) north of Los Angeles to over 4,267 m (14,000 feet) at Mt. Whitney south and east of Yosemite National Park. The ridge line along the Sierra Nevada near Yosemite National Park is generally between 3–3,658 m (10–12,000 feet).
East of the Sierra Nevada the elevation drops to about 1,524 m (5,000 feet) between north-south ridges a few thousand feet higher over the deserts of eastern California, Nevada, Utah, and Arizona. The total precipitation is shown in various shades of color with the color code displayed in millimeters (mm) beneath each figure. The color codes are different for each diagram in order to display the greatest detail. For colder temperatures the precipitation patterns generally show a close relationship between precipitation and the location of mountains. The heaviest precipitation occurred in the Sierra Nevada. At warmer sea-surface temperatures the precipitation seemed to be somewhat more controlled by the location of the coastline. The precipitation was more widely distributed over the entire region and less dependent upon elevation.
Precipitation for the Deep Upper Low storm varied from a low of 5 mm (~¼ inch) in the San Joaquin Valley upwind of the Sierra Nevada and in the desert to the east for an sea-surface temperature = 0°C to a high of over 3,000 mm (~125 inches) in the Sierra Nevada to the southeast of Yosemite National Park for an sea-surface temperature = 45°C. Moderately heavy precipitation occurred along the coast of California for sea-surface temperature = 30°C, but not as heavily as was found for the Pineapple Express storm or for the Rex Blocking Pattern storm.
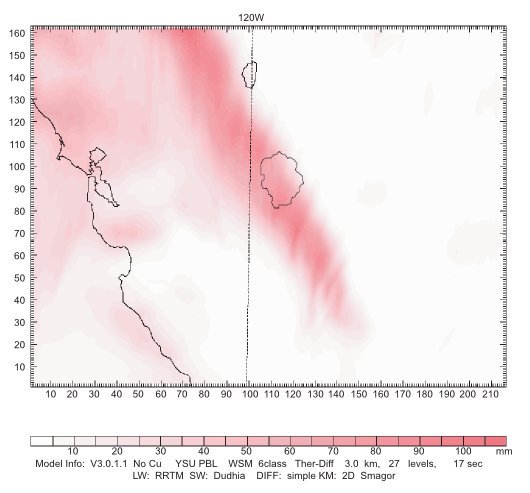
Fig. 10. Total Deep Upper Low storm precipitation for sea-surface temperature = 0°6C. Run time four days. East/west and north/south distances in number of grids with 3 km (1.8 mile) grid lengths.
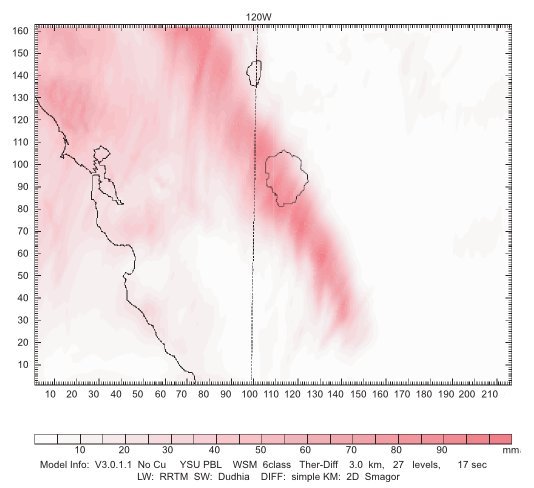
Fig. 11. Total Deep Upper Low storm precipitation for sea-surface temperature = 10°C. Run time four days. East/west and north/south distances in number of grids with 3 km (1.8 mile) grid lengths.
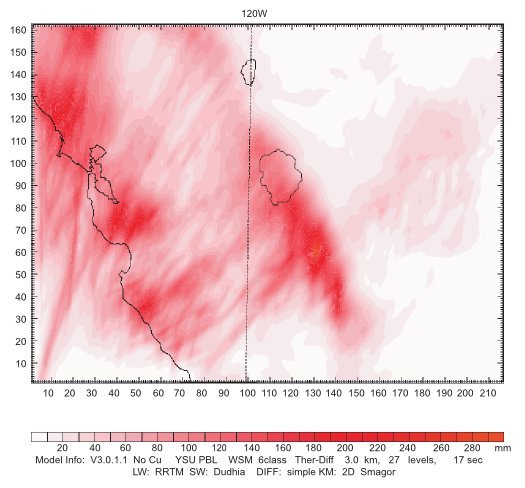
Fig. 12. Total Deep Upper Low storm precipitation for sea-surface temperature = 20°C. Run time five days. East/west and north/south distances in number of grids with 3 km (1.8 mile) grid lengths.
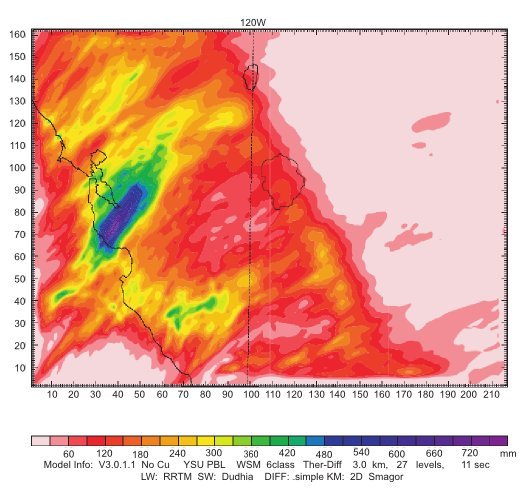
Fig. 13. Total Deep Upper Low storm precipitation for sea-surface temperature = 30°C. Run time five days. East/west and north/south distances in number of grids with 3 km (1.8 mile) grid lengths.
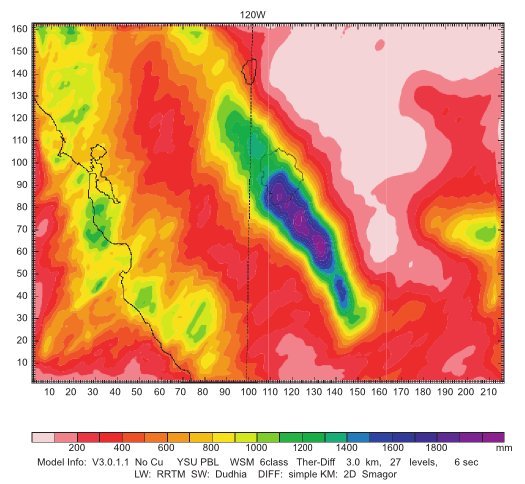
Fig. 14. Total Deep Upper Low storm precipitation for sea-surface temperature = 40°C. Run time five days. East/west and north/south distances in number of grids with 3 km (1.8 mile) grid lengths.
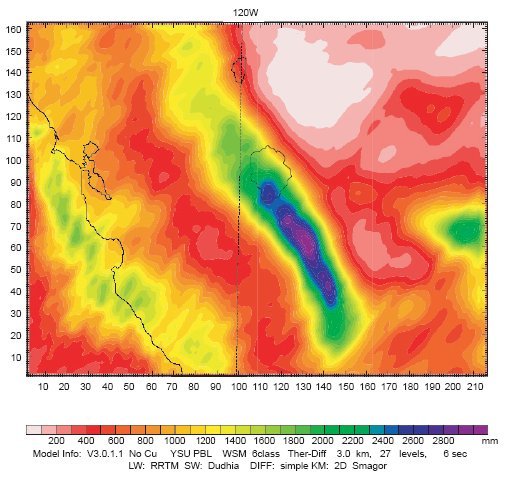
Fig. 15. Total Deep Upper Low storm precipitation for sea-surface temperature = 45°C. Run time 4.5 days. East/west and north/south distances in number of grids with 3 km (1.8 mile) grid lengths.
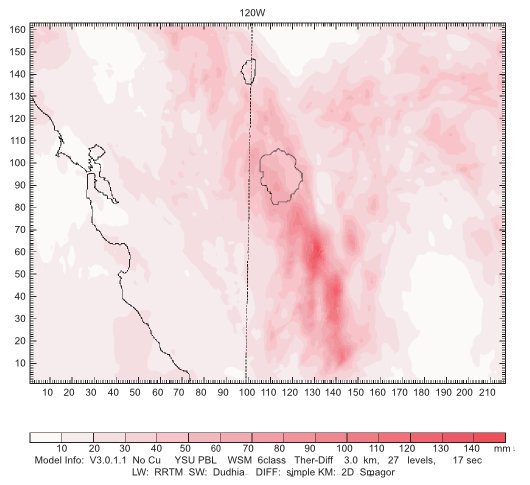
Fig. 16. Total Rex Blocking Pattern storm precipitation for sea-surface temperature = 0°C. Run time 5.5 days. East/west and north/south distances in number of grids with 3 km (1.8 mile) grid lengths.
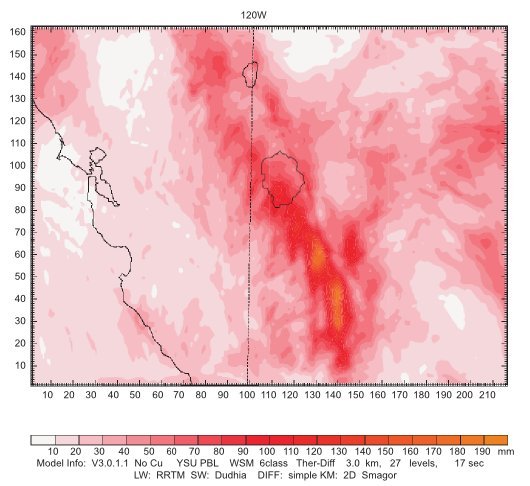
Fig. 17. Total Rex Blocking Pattern storm precipitation for sea-surface temperature = 10°C. Run time six days. East/west and north/south distances in number of grids with 3 km (1.8 mile) grid lengths.
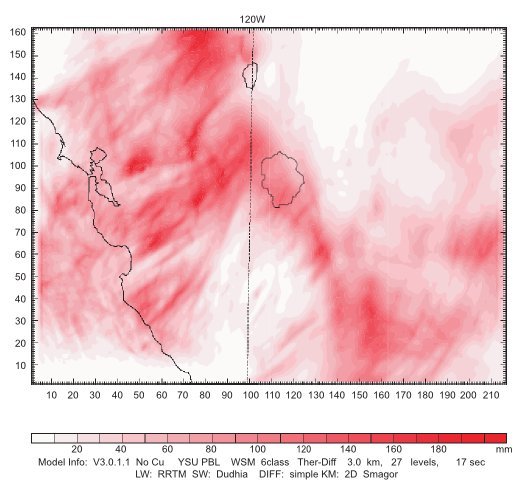
Fig. 18. Total Rex Blocking Pattern storm precipitation for sea-surface temperature = 20°C. Run time six days. East/west and north/south distances in number of grids with 3 km (1.8 mile) grid lengths.
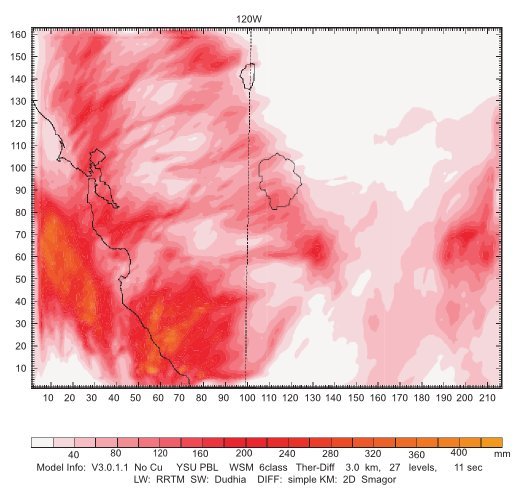
Fig. 19. Total Rex Blocking Pattern storm precipitation for sea-surface temperature = 30°C. Run time 4.5 days. East/west and north/south distances in number of grids with 3 km (1.8 mile) grid lengths.
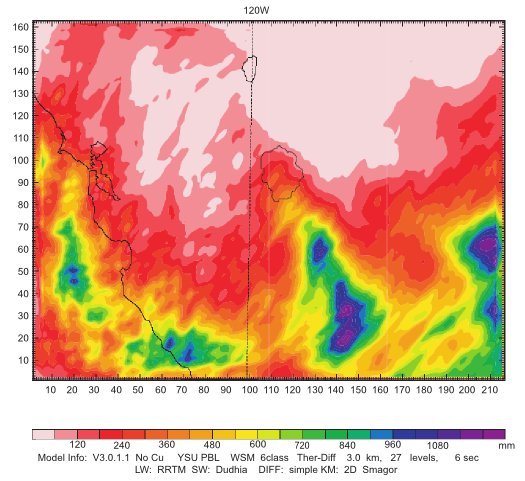
Fig. 20. Total Rex Blocking Pattern storm precipitation for sea-surface temperature = 40°C. Run time 4.5 days. East/west and north/south distances in number of grids with 3 km (1.8 mile) grid lengths.
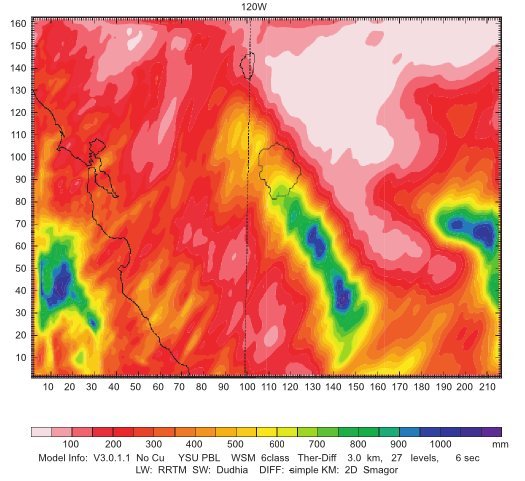
Fig. 21. Total Rex Blocking Pattern storm precipitation for sea-surface temperature = 45°C. Run time three days. East/west and north/south distances in number of grids with 3 km (1.8 mile) grid lengths.
Precipitation for the Rex Blocking Pattern storm varied from a low of less than 10 mm (~½ inch) in the San Joaquin Valley and westward to the coast upwind of the Sierra Nevada for an sea-surface temperature = 0°C to a high of over 1,100 mm (~40 inches) along the southern portion of the study area for an sea-surface temperature = 40°C. This heavy precipitation occurred over the California coast about 32 km (20 miles) west of Monterrey, the coast and coastal range just north of Santa Barbara, the southern Sierra Nevada southeast of Yosemite National Park, and the Black Mountains south of Las Vegas.
The Rex Blocking Pattern storm was somewhat similar to the Pineapple Express case as short waves forced moisture from the ocean onto the coast and mountains, but was more intermittent because of multiple pulses within the storm. It was significantly different in its north/south extent, however. The main path of moisture and precipitation did not cover the entire West Coast, but was more limited to southern California and the southern Sierra Nevada. The limited region of precipitation from north to south can be located differently depending upon the position of the closed circulation off the California coast. If the Rex Blocking Pattern did not extend as far south, the closed circulation would be farther north and, consequently, the precipitation pattern would be farther north.
Like the Pineapple Express storm, precipitation for the Deep Upper Low and Rex Blocking Pattern storms increased strongly in the Sierra Nevada as a function of sea-surface temperature. The effect was more marked for the Deep Upper Low case. Precipitation in both types of storms also increased over the ocean and the coastline at warmer sea-surface temperatures. Precipitation in the deserts downwind of the Sierra Nevada increased as a function of seasurface temperature, but more so for the Rex Blocking Pattern storm.
Table 9 shows the average storm precipitation as a function of storm, sea-surface temperature, and location for the simulated cases. The storm precipitation for the Deep Upper Low case increased from about 500 mm (20 inches) for the actual storm to about 3,000 mm (118 inches) at 45°C in the Sierra Nevada. This was an increase by a factor of about 6 as the sea-surface temperature increased. The valley precipitation upwind of the Sierra Nevada increased from about 50 mm (2 inches) in the actual storm to about 500 mm (20 inches) at 45°C. This was an increase by a factor of about 10. The coastal precipitation increased from about 80 mm (3 inches) for the actual storm to about 500 mm (20 inches) at 45°C. This was an increase by a factor of about 6. Although the desert precipitation also increased as the sea-surface temperature was warmed, the magnitude of the precipitation was relatively small.
The storm precipitation for the Rex Blocking Pattern case increased from about 100 mm (4 inches) for the actual storm to about 500 mm (20 inches) in the Sierra Nevada at an sea-surface temperature of 40°C. This was an increase by a factor of about 5. The valley precipitation upwind of the Sierra Nevada increased from about 25 mm (1 inch) in the actual storm to about 200 mm (8 inches) at 40°C. This was an increase by a factor of about 8. The coastal precipitation increased from about 75 mm (3 inches) to about 500 mm (20 inches) at 40°C. This was an increase by a factor of over 6. Although the desert precipitation remained small in magnitude it increased from about 19 mm (7 inches) for the actual storm to about 100 mm (4 inches) at 40°C for an increase of a factor or almost 6. Like the Deep Upper Low case the magnitude of the precipitation in the desert was relatively small. Values of sea-surface temperature = 45° for the Rex Blocking Pattern case were not used because the simulation did not run to completion.
| Sea-surface temperature (°C) | Ocean precipitation (mm) | Coastal precipitation (mm) | Valley precipitation (mm) | Sierra precipitation (mm) | Desert precipitation (mm) |
|---|---|---|---|---|---|
| Deep Upper Low | |||||
| 0 | 0 | 10 | 5 | 100 | 0 |
| 10 | 5 | 10 | 20 | 100 | 5 |
| 20 | 50 | 120 | 50 | 150 | 10 |
| 30 | 200 | 350 | 200 | 200 | 30 |
| 40 | 700 | 1,000 | 300 | 1,500 | 100 |
| 45 | 800 | 1,400 | 500 | 3,000 | 200 |
| Rex Blocking Pattern | |||||
| 0 | 10 | 10 | 20 | 100 | 30 |
| 10 | 20 | 30 | 20 | 120 | 40 |
| 20 | 60 | 100 | 50 | 120 | 40 |
| 30 | 300 | 300 | 50 | 140 | 40 |
| 40 | 700 | 500 | 200 | 500 | 100 |
Precipitation along a SW/NE line perpendicular to the Sierra Nevada
Fig. 22 shows the mid-size model domain with a line 60° relative to north and perpendicular to the Sierra Nevada. Figs. 23 and 24 show the precipitation for the Deep Upper Low and Rex Blocking Pattern storms, respectively, from southwest to northeast along the 60° line centered on Mount Hoffman in Yosemite National Park as a function of sea-surface temperature. The 60° line is parallel to the typical flow of air over the mountain in most storms although the flow is more southerly near the surface and more westerly aloft. The 60° line runs from off the coast of central California near Monterey, across the Sierra Nevada into Nevada and Utah just south of the Great Salt Lake, ending near Lander, Wyoming.
The main peaks of precipitation from left to right in the Deep Upper Low storm of Fig.23 are caused by the Coastal Range near the California coast, the Sierra Nevada in Eastern California, the Wasatch Range in central Utah, and the Wind River Range in the Rocky Mountains. The topography is much less obvious in the Rex Blocking Pattern storm of Fig. 24. In particular, the mountains of the Sierra Nevada did not show up strongly in the precipitation distribution for the Rex Block Pattern case, although the mountains of Utah and Wyoming were apparent at sea-surface temperature = 40°C. Precipitation over the ocean and the California Coast became significant at the warmer sea-surface temperatures. Please note two caveats for Figs. 23 and 24: (1) The vertical scale for precipitation in both figures is the same, so that it is more evident here that the magnitude of precipitation for the Deep Upper Low storm is greater than the Rex Blocking Pattern storm and (2) the magnitude of the 45°C line (light brown) in the Rex Blocking Pattern storm of Fig. 24 is diminished because the run was only about half the life of the actual storm—the position of the light brown line at the left end of the figure should be higher than the light blue line.
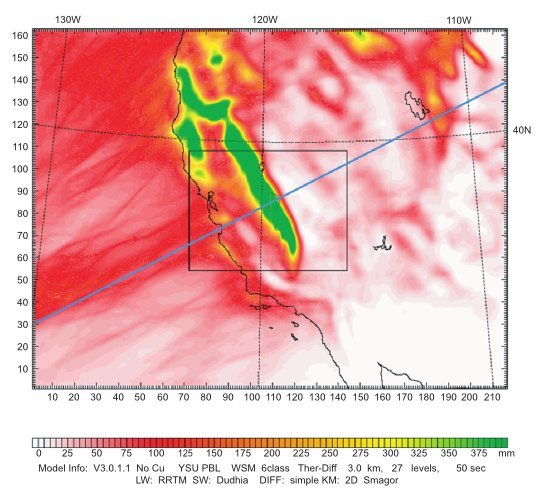
Fig. 22. Mid-size domain with a 60° line perpendicular to the Sierra Nevada. The colors indicate total accumulated precipitation in mm. This display is the accumulated precipitation after eight days for the Pineapple Express case. East/west and north/south distances or in 9 km (5.5 mile) grid lengths.
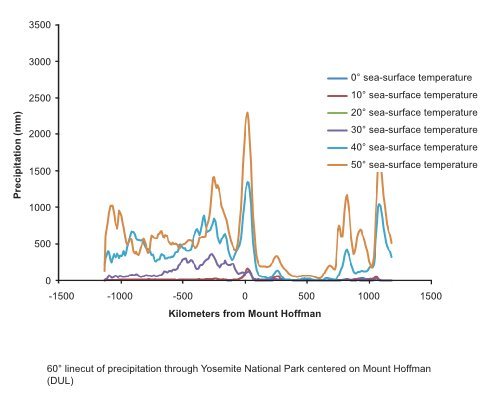
Fig. 23. Precipitation for the Deep Upper Low storm from southwest to northeast along a 60° line centered on Mount Hoffman as a function of sea-surface temperature.
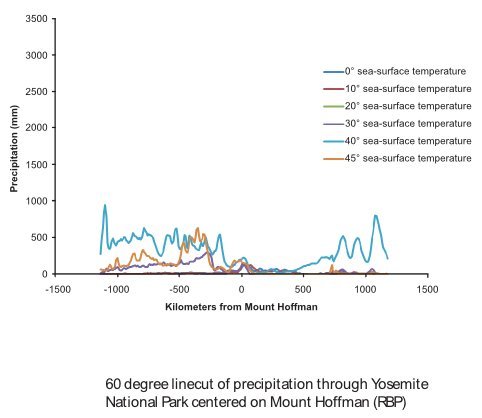
Fig. 24. Precipitation for the Rex Blocking Pattern storm from southwest to northeast along a 60° line centered on Mount Hoffman as a function of sea-surface temperature.
Notice that the precipitation increased with seasurface temperatures over each of the mountain ridges. It also increased more strongly at higher temperatures. This will be discussed more fully in the next section. Between the mountain ridges the precipitation remained relatively low, particularly in the deserts of Nevada and Utah. However, over the Pacific Ocean off the coast of California the precipitation increased strongly with sea-surface temperatures although there is little orographic influence. This widespread precipitation was noted earlier in the horizontal displays of precipitation for high values of sea-surface temperatures and is believed to be due to instability over the warm ocean producing convection. This instability also extended onto the continent and the coastal range and into the Central Valley of California.
Accumulation of precipitation in Yosemite National Park as a function of sea-surface temperature
Figs. 25 and 26 display the accumulated WRF model precipitation as a function of simulation time and sea-surface temperature for the Deep Upper Low and the Rex Block Pattern storms, respectively. The precipitation shown here is for the maximum cumulative value from among each of the grid points within the Yellowstone National Park boundary shown in Figs. 10–21. The precipitation accumulates more rapidly for the warmer sea-surface temperatures indicating a higher precipitation rate at warmer temperatures, as would be expected. The WRF computed precipitation for the actual storm occurs between the 20°C and 30°C cases. This would be expected since the sea-surface temperature for the actual storm averaged about 22°C, although its sea-surface temperature was not distributed homogeneously over the Eastern Pacific as was the case for the simulations. Note, the accumulation curves for the various sea-surface temperatures do not increase regularly as expected. For example, in Fig. 25, the 20°C accumulation curve falls below the 10°C curve between about 70 and 95 hours. In Fig. 26, the 30°C curve falls below the 0°C and 10°C curves until about 100 hours of the simulation and stays below the 20°C curve during the entire simulation. Even the 20°C and 40° curves fall below the 0°C and 10°C curves until about 75 hours and 55 hours, respectively.
The reason the model produces this result is probably due to the manner in which the accumulated precipitation is computed in Yosemite National Park. The location of the maximum precipitation footprint in the Sierra Nevada is strongly dependent upon the seasurface temperature, particularly at about 30°C, and moves westward, eastward, and north and south on the mountain barrier as the storm dynamics vary. The computed accumulated precipitation, however, is fixed to within the boundary of Yosemite National Park. Note, for example, in Figs. 12–15 for the Deep Upper Lower case, how much the maximum precipitation pattern moves around relative to the Yosemite boundary as sea-surface temperature changes. Note a similar effect for the Rex Blocking Pattern case in Figs. 18–21. To obtain a more accurate estimate of the effect of SST on accumulated precipitation would probably require a Lagrangian targeting system (precipitation measurements moving with the air patterns) rather than the Eulerian targeting system used here (precipitation measurements fixed to the topography). Such an effort was beyond the scope of this study.
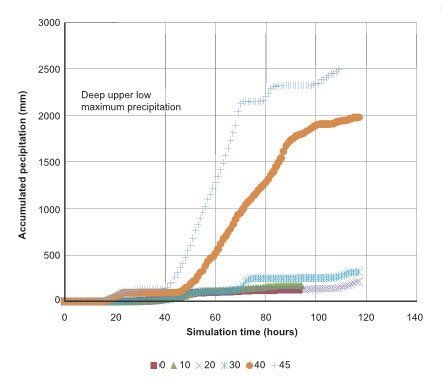
Fig. 25. Accumulated WRF model precipitation for the Deep Upper Low storm in Yosemite National Park as a function of simulation time and sea-surface temperature.
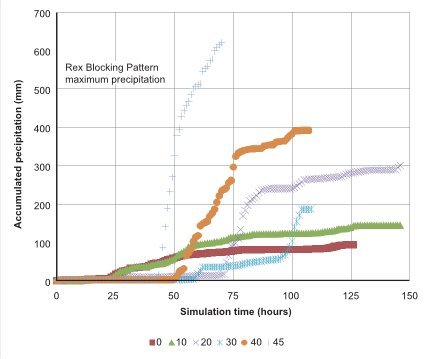
Fig. 26. Accumulated WRF model precipitation for the Rex Blocking Pattern storm in Yosemite National Park as a function of simulation time and sea-surface temperature.
The difference in the accumulated precipitation is greater at higher temperatures, for example, the difference is about 50 mm (19 inches) between 0°C and 10°C and 300 mm (12 inches) between 40°C and 45°C. This would be expected since the rate of growth of snow in clouds and the formation of precipitation should be proportional to the water vapor available for cloud processes. But, the amount of water vapor is an exponential function of sea-surface temperature as governed by the Clausius-Clapeyron equation. This is a well-known chemical-physics equation that relates water vapor pressure in air to the temperature of a nearby water surface.
According to this logic the accumulated precipitation should be an exponential function of sea-surface temperature. Under the same storm conditions, the accumulated precipitation in Yosemite National Park should be about six times greater at 45°C than at 0°C. The observed ratio between the computed precipitation in Yosemite National Park and that observed for the actual storm case with an average sea-surface temperature of about 22°C was about 6 for the Deep Upper Low storm. The observed ratio between the computed precipitation and the actual storm precipitation was about four times greater at 45°C than at 0°C on the coastal range and six times greater in the upwind valley for the Rex Blocking Pattern case. Consequently, when the sea-surface temperature of the Eastern Pacific is warm, large amounts of precipitation should fall in the Sierra Nevada or along the coast range. When the sea-surface temperature is cold only small amounts should accumulate, as shown in Figs. 25 and 26.
Increased glacier growth
This study has shown that precipitation can be increased by a factor of 6 or more during the presence of Deep-Upper-Low–type storms in the Sierra Nevada if the sea-surface temperature of the Pacific Ocean is warm. This type of storm occurs most frequently and contributes the largest amount of snow in the high country of the Sierra Nevada. Such a large increase in precipitation would readily lead to larger, more permanent glaciers if the precipitation continued to accumulate from one year to another. Unlike the Pineapple-Express–type storms reported by Vardiman and Brewer (2010) snow typically falls at a relatively low elevation for these type of storms, rain does not fall on the snow at the ridge line, nor does snow melt between storms.
The second case addressed in this study was the Rex Blocking Pattern storm type. This study showed that although the precipitation could be increased by a factor of about 4 over the ocean and along the coast range and by a factor of about 6 in the valley upwind of the Sierra Nevada, the snow in the Sierra Nevada would only be increased by a factor of about 2. In addition, because of the intermittent warm nature of this type of storm, these storms would likely produce frequent rain at high elevations. The Rex Block Pattern storm seems to produce its greatest precipitation along the coast. In addition, the Rex Block Pattern storm is much less frequent today than the Deep Upper Low type of storm discussed above. Rex Blocking Patterns are not uncommon, but the induced cyclonic flow off the California coast doesn’t occur under all Rex Blocks. In addition, the cyclonic flow pattern associated with them will only produce limited regions of precipitation on the south and east side of the cyclone and the cyclone typically occurs at highly variable locations.
Finally, when an El Niño type of weather pattern occurs today, a Rex Blocking Pattern does not typically develop. The storms tend to sweep easily off the Pacific Ocean onto the North American continent and produce stormy weather across the entire United States under only slightly warmer seasurface temperatures of an El Niño (typically 1–2°C). Because an ice age with a warm ocean is thought of by these authors as a “giant” El Niño event, it is highly unlikely that the Rex Blocking Pattern type of storm will even occur. Consequently, for all of these reasons, it is assumed that unless some unusually long-lasting blocking pattern occurs, this storm type will probably not contribute much precipitation to glacial growth during the ice age.
This study considered the characteristics of colder storms coming from the west and northwest associated with a deep trough off the West Coast of the United States during ice age conditions. Crowley and North (1991) have shown that the path of the jet stream was positioned much further south during the ice age—crossing from the Pacific Ocean onto the North American continent near San Francisco. Such a position would have caused the frequency of storms crossing the Sierra Nevada to be increased greatly, probably more than doubling the number of storms which dump rain and snow each winter over the southern Sierra Nevada. Furthermore, the storms would probably have been colder due to cold, polar air being displaced farther south. And, the winter season would have been extended into the summer reducing the melting of glaciers.
Multiplying these two effects together—the increase in precipitation due to warmer sea-surface temperatures and the greater frequency of cold storms—it is likely that the snowfall from this type of storm in Yosemite National Park and the Sierra Nevada in general, would have been 12 times greater than what it is today (six times or more precipitation per storm and twice as many storms). It is also likely that less of the glaciers in the mountains would have melted in the summer due to the extended winter season. Following the Genesis Flood volcanic ash would have also been prevalent in the atmosphere, blocking the sun and keeping the continents cold with little summer melting.
An estimate will be made here of the increased precipitation due to the Deep Upper Low and the Pineapple Express types of storm reported earlier by Vardiman and Brewer (2010). The Rex Blocking Pattern type of storm will be ignored because of its low probability of consistently contributing to the snowpack. The Pineapple Express type of storm reported in Vardiman and Brewer (2010) was found to precipitate a total of 700 mm (28 inches) to 2,000 mm (79 inches) per week depending upon sea-surface temperature. A Deep Upper Low type of storm from this study was found to precipitate a total of 500 mm (20 inches) to 2,500 mm (98 inches) per storm depending upon sea-surface temperature. Considering the amount of precipitation from these two types of storm it is possible to calculate the depth of glaciers that will accumulate in Yosemite National Park if no melting occurs in the summers. For example, a storm that precipitates 1,000 mm (39 inches or 3.3 feet) will contribute that same amount of ice to a glacier. Snow would be 5 to 10 times deeper initially, but it would be compressed to the density of ice over time. The glacier thickness calculated here was for ice after compression. Ice has approximately the same density as water (differing only by about 10%). If only one Deep Upper Low storm precipitated 500 mm each year without melting, the glacier would be about 50 m thick (162 feet) in 100 years. An estimate of 500 mm per storm and one storm per year is an extremely low estimate based on the simulations done in this study.
Deep Upper Low types of storm are the most frequent storms which affect the West Coast. Today, about ten such storms affect the Northwest during an average year. The range is probably between four storms during a dry year to 20 or more during a wet year. Assuming the average number of ten storms is doubled to 20 storms because the jet stream was positioned farther south over San Francisco during the ice age (Crowley and North 1991) and each storm precipitated 500 mm (20 inches) per storm or 1,000 mm (39 inches) per week (since a typical storm only lasts 3.5 days—not a week, like a Pineapple-Express–type storm), then the glacier would grow to over 3,000 feet (914 m) thick in 100 years.
Fig. 27 shows glacier depth as a function of precipitation rate and frequency of storms in Yosemite National Park. Notice that glacier thickness is a function of precipitation rate, frequency of storms, and the length of an ice age. The blue oval in Fig. 27 represents an average condition which could have occurred during an ice age with a warm ocean. Since precipitation rate is a function of sea-surface temperature and storm frequency is a function of the location of the jet stream, it appears that the presence of glaciers in Yosemite National Park during an ice age can easily be explained by warm sea-surface temperatures and a more southerly position of the jet stream. Some melting of the glaciers would likely occur depending on the length and temperature of the summers.
Pineapple Express storms would also contribute to the growth of the glaciers. Vardiman and Brewer (2010) estimated that a Pineapple Express storm would likely produce snow with a water equivalent of 1,000 mm (39 inches of rain) and would last about a week. If one Pineapple Express type of storm is assumed to occur each year in addition to 20 Deep Upper Low type of storms, the annual snowfall would be over 11,000 mm (36 feet water equivalent). Assuming this series of storms occurred annually for 100 years, the depth of the glacier would be over 3,500 feet (1,067 m). If the ice age lasted 200 years, the depth would be 7,000 feet (2,133 m), etc. Using even higher estimates of precipitation rate, which is readily accommodated, this model explains glaciers thousands of feet deep in Yosemite National Park and the Sierra Nevada.
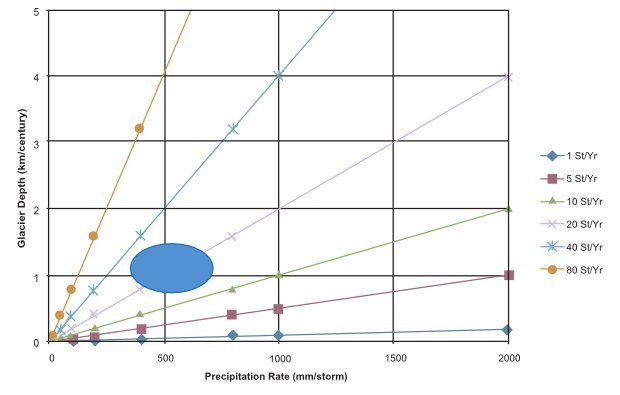
Fig. 27. Glacier depth as a function of precipitation rate and storm frequency. The blue ellipse represents the minimum likely glacier depth of about 1 km per century, given greater precipitation per storm for warm sea-surface temperatures and increased storm frequencies due to the jet stream moving farther south during the ice age.
Conclusions
Two types of cold, winter storms in Yosemite National Park have been successfully simulated and reported—Deep Upper Low and Rex Blocking Pattern storms. Numerical simulations of warm seasurface temperatures in the eastern Pacific Ocean were conducted to find how much precipitation in Yosemite National Park would have been increased by warmer sea-surface temperatures. Warm sea-surface temperatures would have increased precipitation from Deep Upper Low types of storms in Yosemite National Park and throughout the Sierra Nevada by a factor of about 6. Regions upwind and downwind of the Sierra Nevada would have also been increased by factors of at least 6 for warm sea-surface temperatures, but the magnitude of precipitation would have been only about 10% of that in the mountains. In addition, much of this precipitation would likely have fallen as rain and not contributed to glaciers.
Precipitation from Rex Blocking Pattern storms for warm sea-surface temperatures would have also increased the precipitation amount in the Sierras by a factor of about 6. But, because of a series of factors (minimal enhancement of precipitation by warm sea-surface temperatures, intermittent occurrence of storms, limited coverage in the Sierra Nevada, low frequency compared to Deep Upper Low type of storms, and the likelihood that Rex Blocking Pattern storms did not occur during the ice age) we concluded that enhancement of Rex Blocking Pattern storms did not contribute significantly to glacial growth. The enhanced snowfall and greater frequency of the Deep Upper Low type of storms appears to be the primary explanation for glaciation in the Sierra Nevada during an ice age in a young-earth time frame.
If 20 Deep Upper Low storms and one Pineapple Express storm occurred each year for 100 years during the ice age, the depth of glaciers in Yosemite National Park was estimated to be at least 3,500 feet (~1 km). Glaciers thousands of feet thick could have readily developed in Yosemite National Park following the Genesis Flood.
Acknowledgments
The mesoscale meteorology model (WRF) used in this study was developed and maintained by the National Center for Atmospheric Research (NCAR 2007) available at http://www.wrf-model.org/index. php. The meteorological and topographic data (NARR) used in this study were provided by the National Oceanographic and Atmospheric Administration (NOAA) National Operational Model Archive amp; Distribution System available online at http://www.emc.ncep.noaa.gov/mmb/rreanl/. Richard Carpenter and Brent Shaw of Weather Decision Technologies, Inc., and Valentine Anantharaj and Xingang Fan of Mississippi State University offered occasional assistance in the use of WRF. This research was funded by the National Creation Research Foundation of the Institute for Creation Research.
References
Crowley, T. J. and G. R. North. 1991. Paleoclimatology. Oxford Monographs on Geology and Geophysics no. 18, pp. 71–91. New York: Oxford University Press.
Kozlowski, D. and M. Ekern. 2005. Retrieved from http://www.cnrfc.noaa.gov/storm_summaries/feb2005storms.php
Kozlowski, D. and M. Ekern. 2006. Retrieved from http://www.cnrfc.noaa.gov/storm_summaries/april2006storms.php
National Center for Atmospheric Research. 2003. Retrieved from http://www.mmm.ucar.edu/mm5/
National Center for Atmospheric Research. 2007. Retrieved from http://www.wrf-model.org/index.php
Vardiman, L. 2008. A proposed mesoscale simulation of precipitation in Yosemite National Park with a warm ocean. In Proceedings of the Sixth International Conference on Creationism, ed. A. A. Snelling, pp. 307–319. Pittsburgh Pennsylvania: Creation Science Fellowship; Dallas, Texas: Institute for Creation Research.
Vardiman, L. and W. Brewer. 2010. Numerical simulation of precipitation in Yosemite National Park with a warm ocean: A Pineapple Express case study. Answers Research Journal 3:23–36. Retrieved from https://answersingenesis.org/environmental-science/ice-age/simulation-of-precipitation-in-yosemite-with-warm-ocean/