
Research conducted by Answers in Genesis staff scientists or sponsored by Answers in Genesis is funded solely by supporters’ donations.
Abstract
I examine two explanations for the cosmic microwave background (CMB) that recent creationists have proposed, 1) radiation from dust, and 2) Eddington’s “temperature of space” computation. Both of these suggested sources have problems. Radiation from dust is too clumpy and has too high temperature to be the source of the CMB. Eddington’s model of the “temperature of space” differs from the characteristics of the CMB in at least three ways. I also examine some claims from critics of the big bang that the CMB plots have been manipulated to mimic a blackbody spectrum and find that argument to be baseless. I briefly survey four problems with the CMB being the remnant of the big bang. These considerations present the possibility that no one yet knows the true origin of the CMB.
Keywords: big bang, blackbody, Cosmic Microwave Background
Introduction
The Cosmic Microwave Background (CMB) is generally regarded as the best evidence for the big bang theory. Penzias and Wilson (1965) discovered the CMB in 1964, and they received the 1978 Nobel Prize in Physics in recognition for this work. The prediction of the CMB usually is attributed to George Gamow in 1948, but proper credit ought to go to Alpher and Herman (1948a).1 Shortly thereafter Alpher and Herman (1948b) estimated the CMB temperature to be 5K, but two years later they revised it to 28K (Alpher and Herman 1950). Gamow (1952) estimated a temperature of 50K, but later he calculated a temperature of 6K (Gamow 1956). In conjunction with the publication of Penzias and Wilson, Dicke et al. (1965) computed a rough upper limit of 40K for the CMB. Recent creationists sometimes note that the temperature of the CMB is less than any values that had been predicted prior to its discovery, and hence conclude that the CMB is not evidence of the big bang. The range in these estimates stemmed from the many uncertainties in the big bang model of that time (the model was new, and the name “big bang” wasn’t even coined by Sir Fred Hoyle until 1950). Among the uncertainties were the expansion rate (and hence the age) and the density of the universe. The important thing is that the big bang theory predicted that the universe ought to be permeated by low-temperature blackbody radiation. This is a qualitative prediction, and creationists ought not to quibble over the modest range in the early quantitative temperature estimates or that the actual CMB temperature is slightly below the range.
According to the big bang model, the universe suddenly appeared in a very hot, dense, expanding state. During subsequent adiabatic expansion, both the density and temperature of the universe had to decrease. For the first few hundred thousand years, the radiation in the universe could not travel very far before being absorbed by matter. We say that the universe was opaque. The matter would reemit the radiation, but the radiation quickly was reabsorbed and reemitted. This continued until the universe had cooled sufficiently for stable atoms of hydrogen to form for the first time. Now with stable atoms, the universe became transparent, and photons of light were free to travel relatively unencumbered for the first time. Physicists say that matter and radiation became decoupled. Since the universe at this time would have been a relatively dense gas, the radiation would have had a blackbody spectrum (the red curve in Fig. 1 is a blackbody spectrum). A blackbody is an idealized perfect absorber and emitter of radiation. Many real objects approximate blackbody behavior very well. A blackbody has a spectrum characterized by little radiation at shorter wavelengths, a steep rise in emission with increasing wavelength toward a peak, followed by a gradual decline in emission at longer wavelengths. The peak in emission occurs at a wavelength that is inversely proportional to the temperature of the blackbody (Wein’s law). Many objects are good approximations to blackbodies, so physicists and astronomers use Wein’s law to measure the temperatures of many bodies.
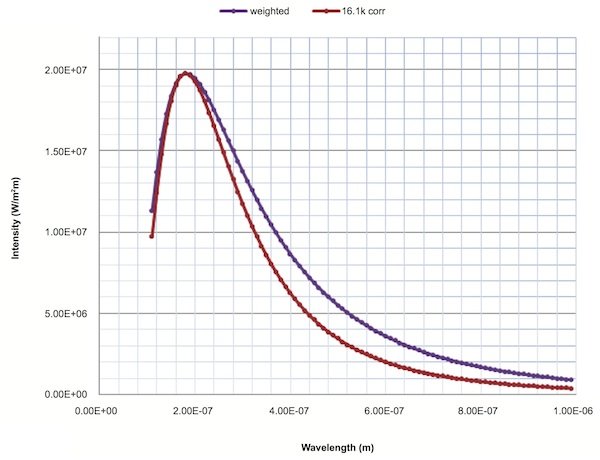
Fig. 1. Comparison of the Eddington radiation field and a 16,100 K blackbody. The blue points are the weighted values of the five spectra comprising the Eddington model. The red points are the computed values of a 16,100K blackbody, normalized to fit the composite Eddington curve at peak wavelength. The line through either curve is the best fit to the respective data.
Cosmologists estimate that the temperature of the universe was about 3000K at the age of decoupling, and so the radiation from that time ought to have a blackbody curve with a peak appropriate for a 3000K blackbody. Over time, an observer would see the blackbody radiation from progressively more distant parts of the universe. That is, if the age of decoupling was 13.8 billion years ago, then today we ought to see radiation coming from all directions and at a distance of 13.8 billion light years. However, while this radiation has traveled to us, the universe has expanded and imparted redshift to the primordial blackbody radiation. The redshift would preserve the blackbody shape of the spectrum, but the characteristic temperature of the spectrum would change in inverse proportion to the size of the universe. Cosmologists estimate that since the age of decoupling the universe has expanded a thousandfold, so the observed temperature of the background radiation ought to be one thousandth of 3000 K, or 3 K. Current measurements indicate a temperature of 2.72548±0.00057K (Fixsen 2009).2
There are several reasons why more than 15 years elapsed from the earliest predictions of the CMB and its detection. First, the papers generally recognized as predicting the CMB didn’t actually predict it. Rather, those papers were more concerned with nucleosynthesis in the early universe, which is temperature sensitive. Those papers estimated the temperature of the universe at various epochs, including today, but at the time there was no direct connection made to the character of the blackbody radiation resulting from the temperature as it might exist today. Second, even if one were to have made the connection so early, the CMB is located in the microwave part of the spectrum, and the technology for making detection there was just being developed in the late 1940s. Third, what was to become the big bang theory was not well-received even as late as the early 1960s. Belief in an eternal universe goes back to at least the ancient Greeks, and so the idea that the universe had a beginning was not popular. Instead, the steady state theory was the dominant cosmology. Thus, there was not much interest in searching for something that few expected to find. Fourth, most of the early papers on the big bang model were published in physics journals rather than astronomy journals, such as The Astrophysical Journal, where astronomers were more likely to take notice of them. According to Alpher’s son (Alpher 2012), Alpher and Herman unsuccessfully tried to interest astronomers in attempting detection of the CMB.
By the early 1960s Dicke and others began to make the connection between the big bang model and the possible existence of a microwave blackbody spectrum permeating the universe. Furthermore, they were aware that the technology of the time permitted detection of a microwave blackbody. So they began to promote the search for the CMB as a good test to distinguish between the big bang and the steady state cosmologies. Simply put, if the CMB were detected, it would be confirmation of the big bang model, but failure to find the CMB would eliminate the big bang model from further consideration. However, in the steady state theory there never was an age of decoupling, so the steady state theory predicted that there is no CMB. Thus, detection of the CMB would disprove the steady state, while failure to detect the CMB would be a confirmation of the steady state model.3 The 1965 announcement of the measurement of the CMB was a revolution in cosmology. The big bang very quickly replaced the steady state as the dominant cosmology, and it remains so today.
Interestingly, in retrospect many think that the honor of the first detection of the CMB ought to go to Andrew McKellar (1941). He measured absorption lines from rotational states in CN molecules (also known as cyano radicals) in interstellar space, and concluded that they resulted from molecules at a temperature of 2.3K. McKellar compared this temperature to a similar “temperature of space” earlier deduced by Eddington (1926). I shall discuss Eddington’s work shortly. Only after the detection of the CMB did astronomers begin to interpret the rotational states of CN that McKellar measured as being due to excitation from the CMB. In retrospect, there were other accidental detections of the CMB as well, such as those of Dicke et al. (1946).
Creationist Responses to the CMB
The big bang model is contrary to the Bible and the recent creation model (Morris 2003, pp. 136–137). Since in our view the big bang never happened, the CMB requires some alternate explanation. An early attempt was that of Akridge, Barnes, and Slusher (1981). In their paper these authors began by arguing that the big bang model does not predict the CMB. This attempt was based upon a common misunderstanding of the big bang. This misconception is that the big bang was an explosion of matter and energy into already existing space. This view allows for space to exist outside of the big bang, space for the eventually decoupled radiation to pass into, thus exiting the portion of the universe that has mass. According to this reasoning, since we live in the portion of the universe that has mass, no CMB would be visible to us. As I’ve previously pointed out (Faulkner 2003, pp.66–68, also available on-line: www.answersingenesis.org/articles ud/misconceptions-general-relativity-cosmology-big- bang), this is a common misconception of the big bang. Rather, the big bang model posits that the entire universe was filled with energy and matter at the instant of the big bang, and it was space itself that expanded. Thus, while radiation was decoupled from matter in the sense that it no longer greatly interacted with matter, both the radiation and matter occupied the same space. Shortly after publication of the article by Akridge, Barnes, and Slusher, Steidl (1983) attempted to correct the errors in a letter, but in his reply to the letter Akridge merely reasserted the errors.
Akridge, Barnes, and Slusher attempted an explanation of the CMB by claiming that it came from dust within our galaxy. In his letter, Steidl also pointed out that this explanation had been attempted already (by supporters of the steady state model), but that this explanation was lacking. The primary problem is that dust is very clumpy, and hence we would expect that if the CMB came from dust the CMB would be very clumpy. However, the CMB is very homogeneous. Since the publication of this article and letter, orbiting infrared instruments (to get above the infrared blocking of the earth’s atmosphere) have enabled us to map the contribution of dust very well. Galactic dust shows up along the galactic plane (very inhomogeneous), and at a temperature warmer than the CMB. For instance, see Plate 2 in Draine (2011, following p.126).
Eddington’s “Temperature of Space”
Sir Arthur Eddington (1926, pp. 371–372) combined the estimated effect of the light of all stars in the galaxy to determine that the effective “temperature of interstellar space” is 3.18K. Considering that this was just an estimate, the coincidence with the temperature of the CMB is remarkable. The coincidence has led some recent creationists to conclude that this is the true source of the CMB (Byl 2001, p. 258; Brown 2008, p. 85; Williams and Hartnett 2005, pp.127, 226). Creationists are not alone in this, for non-creationist critiques of the big bang model have suggested Eddington’s calculation as well (for instance, see Assis and Neves 1995). However, this is fraught with problems. Eddington began his calculation with an estimate that the total starlight received near the earth is equivalent to that of about 1000 first magnitude stars. He performed a bolometric correction for non F and G spectral type stars to reach a number of about 2000 first magnitude stars. A bolometric correction is to account for light not in the visible part of the spectrum. Stars much hotter than F and G types produce much of their radiation in the ultraviolet, while cooler stars shine much of their radiation in the infrared. Knowing the equivalent energy density of a single first magnitude star, he found the total energy density of all stars by multiplying by 2000. The equation for energy density, E = aT4, yields an effective temperature of 3.18K. What does this result mean? Eddington went on to explain,
In a region of space not in the neighborhood of any star this constitutes the whole field of radiation, and a black body, e.g. a black bulb thermometer, will there take up a temperature of 3.18° so that its emission may balance the radiation falling on it and absorbed by it. This is sometimes called the ‘temperature of space.’
What Eddington considered here was the temperature that a blackbody would assume if it were in interstellar space not in close proximity to any stars. A blackbody exposed to radiation will absorb and emit radiation until it comes into equilibrium with the ambient radiation. If the blackbody’s temperature is above the equilibrium temperature, it will emit more radiation than it receives until it reaches equilibrium. If the blackbody’s temperature is below the equilibrium temperature, it will absorb more radiation than it emits until it reaches the equilibrium temperature. At equilibrium temperature the amount of radiation that it absorbs and emits will be equal. The equilibrium temperature depends upon the energy density of the radiation, which is what Eddington estimated. If a blackbody is moved closer to a hot source (such as a particular star), the energy density will be greater, and the blackbody will assume a higher temperature than when farther away from the source. Eddington determined the minimum temperature that a blackbody in interstellar space, far from any stars, and with no other source of energy other than starlight would assume.
In a sense, this calculation underlies the (failed) dust explanation for the CMB. Dust particles in the interstellar medium are good approximations to blackbodies, and they are far enough from stars to be bathed in something like Eddington’s radiation field. However, the distances of particular dust clouds from bright stars vary. Those dust clouds close to bright stars will experience greater radiation density at their locations and hence will have greater equilibrium temperatures than dust clouds farther from bright stars. This is why dust in the interstellar medium is at so many different temperatures.
Eddington calling his calculated equilibrium temperature of a blackbody in space the temperature of space is unfortunate, because the same term is used for the CMB. However, the meaning of the CMB being the temperature of space and what Eddington meant are very different. How are they different? There are three ways. First, the CMB predicted by the big bang model was expected to have a very good blackbody spectrum, and measurements since its discovery have shown that it does. Eddington went on to state,
Radiation in interstellar space is about as far from thermodynamical equilibrium as it is possible to imagine, and although its density corresponds to 3.18° it is much richer in high-frequency constituents than equilibrium radiation of that temperature.
That is, Eddington’s radiation field in interstellar space is nothing like a blackbody spectrum, because it is the superposition of many stars’ spectra. A single star’s spectrum is a close approximation to a blackbody spectrum, but when many blackbody spectra of different temperatures are combined, the resulting spectrum departs from a blackbody spectrum. The major difference is that the combined spectrum will have a broader peak than a blackbody spectrum has. In his paper, Eddington went on to consider matter that had very strong selective absorption. Eddington knew that the radiation field in space was a mixture of radiation coming from various stars, so Eddington assumed that 5% of the radiation field came from stars having temperature of 18,000K, 10% came from stars having 12,000K temperature, 20% from 9000 K, 40% from 6000 K, and 25% from 3000 K. Eddington found that if he considered a body capable of absorbing and emitting only at a narrow wavelength (which is radically different from a blackbody), a much higher equilibrium temperature resulted. For instance, if a body capable of emitting and absorbing only at 600Å were immersed in his adopted radiation field, the body would assume a temperature of 4707K, even while the equivalent temperature of the energy density was only 3.18 K. Of course no natural substance is capable of absorbing thus, but it illustrates how out of thermodynamic equilibrium the radiation field in deep space is.
This mismatch is the second problem with equating Eddington’s model with the CMB. The reason for this surprisingly high temperature of this idealized non blackbody that Eddington considered is that the radiation field “is much richer in high-frequency constituents than equilibrium radiation of that temperature.” Actually, Eddington’s assessment here is a gross understatement. Almost the entire spectrum of the radiation field that Eddington considered is in the portion of the spectrum in the visible and immediately adjacent to the visible. There is essentially zero flux in the microwave part of the spectrum. On the other hand, the CMB is entirely in the microwave. So there is absolutely no match between the CMB and the radiation that Eddington considered.
To illustrate the differences, I asked Colin Michael of the Answers in Genesis IT department to model Eddington’s radiation field in Excel. We used the standard formula for the blackbody spectrum expressed as energy per unit area per wavelength interval,
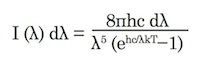
where λ is the wavelength, h is the Planck constant, c is the speed of light, k is the Boltzmann constant, and T it the blackbody temperature in K. For a given temperature we computed emitted radiation at increments of 0.1 × 10⁻⁷ m between 1.1 × 10⁻⁷ and 9.9 × 10⁻⁷ m, inclusively. A smooth curve drawn through the plot of computed emitted radiation as a function of wavelength well represents a blackbody of the given temperature. We could model the contribution of any number of various temperature blackbodies by adding the computed weighted emissions of the several different temperatures and fitting a smooth curve to the points. For instance, we could use this method to model any ensemble of stars, such as those in a galaxy.
Following Eddington’s model, we computed blackbody curves of 18,000 K, 12,000 K, 9000 K, 6000 K, and 3000 K, and combined them with the weights 5%, 10%, 20%, 40%, and 25%. These are the temperatures and percentages of Eddington’s model. Very hot stars are rare, which is the reason for the assumed lower percentages for the hotter spectra. On the other hand, cooler stars, while very common, are very faint, so they produce relatively little to the total flux as well. This is why the weight of cooler stars diminishes. The combined spectrum of this Eddington radiation field superficially resembled a blackbody curve, albeit a bit broader. To compare this to a single blackbody, we read off the wavelength of peak emission from the Eddington model curve and computed the equivalent blackbody temperature from Wein’s law. The corresponding temperature was 16,100 K. Even though the 18,000 K curve had a weight of only 5%, the flux of this highest temperature spectrum in the model is so much greater than the other four components that its curve dominates all others at most wavelengths, so the relatively high equivalent temperature of the Eddington model is not surprising. We normalized the 16,100 K blackbody curve to match the Eddington field at the peak. Fig. 1 shows the plot of these two spectra, the 16,100 K blackbody and Eddington’s model. Notice that two plots match well at the maximum, but that the Eddington radiation field is broader, most notably at longer wavelengths, but also at shorter wavelengths. So, the Eddington model clearly is not a blackbody curve. Furthermore, approximating the Eddington model with a blackbody yields a Wein temperature 16,100K. This is four orders of magnitude greater than the CMB temperature, which means that the wavelengths of the peaks differ by four orders of magnitude.
Given the functional form of blackbody emission, the sum of two or more blackbodies at different temperatures cannot be a blackbody curve. If an ensemble of different temperature blackbodies is dominated by the emission from a single blackbody, then the resulting curve will more closely resemble that of a single blackbody. However, this will work only if the dominant blackbody is much hotter than the others in the ensemble. In the limit that the ensemble curve approaches a true blackbody curve, the non-dominant contributors approach zero, and so the model would revert to a single blackbody curve anyway.
The third problem in equating Eddington’s approximation with the CMB is the difference in isotropy. The CMB is highly isotropic in that the radiation is a precise blackbody of essentially the same temperature regardless of what direction that one looks. True, there is a dipole character as the result of our motion through space, and there are slight spatial temperature fluctuations that are taken as evidence of inhomogeneities in the early universe required to account for the current structure of the universe. However, these variations are of very low magnitude, as evidenced by the difficulty in detecting and measuring them. On the other hand, the radiation field considered by Eddington is highly anisotropic. What Eddington discussed was the energy density from stars integrated over the entire sky. But the actual distribution is highly peaked in the directions of the brightest stars, and the temperature of the blackbody curves will depend upon the temperatures of those brightest stars. From regions of the sky where there are no noticeable stars, the energy density is nearly zero.
In summary, Eddington’s proposal fails to match the CMB on three counts:
- The CMB strongly exhibits a blackbody spectrum, while Eddington’s model does not
- The CMB is entirely in the microwave, while Eddington’s model is in the optical with no appreciable flux in the microwave
- The CMB is very isotropic, but the Eddington model is highly anisotropic
If the CMB is not from the age of decoupling, what is it?
The lack of a good alternate explanation for the CMB in a recent creation framework could lead one to despair. However, the picture for the standard interpretation is cloudy too, for there are a number of documented problems with the CMB resulting from the age of decoupling in a big bang universe. First, a light travel time problem exists in the big bang model in that disparate parts of the universe have the same temperature, even though those parts have not had time to come into thermal equilibrium (Lisle 2003). This difficulty is called the horizon problem. Inflation in the early universe is invoked to explain the horizon problem, but there is no proof that inflation occurred, and modern ideas of inflation have become increasingly bizarre (Steinhardt 2011). Second, there ought to be gravitational lensing in the CMB, but there is none (Samec 2006). Third, Hartnett (2006a) has pointed out that the CMB contains quadrupole and octopole modes that the standard inflationary big bang model cannot explain. Fourth, Hartnett (2006b) also has explained that inverse Compton scattering by electrons (Sunyaev- Zel’dovich effect) in the intergalactic medium within clusters of galaxies ought to distort the CMB, but this is not seen. These last three problems suggest that the CMB, rather than originating in the most distant parts of the cosmos, actually comes from a much closer source or sources, perhaps even within the solar system or even the earth.
If the CMB is locally produced (essentially making it a local microwave background (LMB) rather than the CMB), then it would render the CMB as evidence of the big bang a huge red herring. Given that this would make nearly everything published in cosmology over the past half century wrong, cosmologists will have tremendous resistance to this possibility.
A Cautionary Word
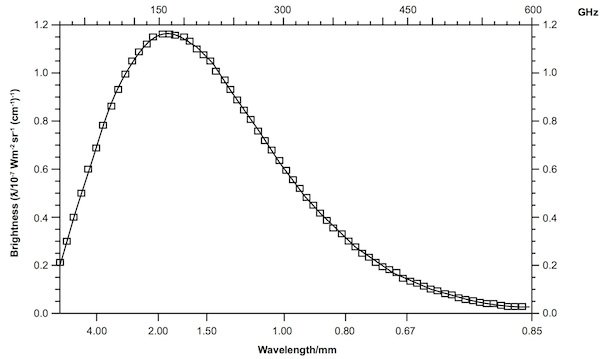
Fig. 2.The first published spectrum of the Cosmic Microwave Background Radiation as measured by the COBE satellite in the direction of the North Galactic Pole (Mather et al. 1990). Within the quoted errors, the spectrum is precisely that of a perfect blackbody at radiation temperature 2.73 ± 0.06 k. The more recent spectral measurements are discussed in the text. The units adopted for frequency on the ordinate are cm-1. A useful conversion to more familiar units is 10-7 Wm-2 sr-1 (cm-1)-1 = 3.34 × 10⁻¹⁸ Wm-2 Hz-1sr-1 = 334 MJ sr-1.
A quick internet search will produce a number of sites that attempt to explain away the CMB by claiming that the CMB is not a fit to a blackbody curve, that the scales of the plotted data have been manipulated to mimic a blackbody curve.4 However, the authors of these complaints do not understand the plots and underlying physics that they are criticizing. Fig. 2, taken from Longair (1998), is a common CMB plot. Complaints about this plot are that the wavelength is not linear, and it increases to the left, not the right. Thus, it is argued, the figure was manipulated falsely to resemble a blackbody curve. However, the solid curve in this plot is not a best fit to data, but rather it is a curve of a blackbody of temperature of 2.735K. Obviously, if the fit to a blackbody is fictitious, then the solid curve must be fictitious as well. There are several problems with this approach. First, while the wavelength scale is not linear in wavelength and does appear to increase the wrong direction, it is a linear scale in frequency increasing to the right. You can see this by converting wavelength to frequency using the equation,
λν=c,
where λ is wavelength, ν is frequency, and c is the speed of light.
There are two different ways to express the intensity, I, the quantity on the vertical axis. One way is to express the intensity Iν as the power per unit area per unit solid angle per frequency interval. In the conventional SI, the units would be W/(m2 sr Hz), where W stands for Watts, m stands for meter, sr stands for steradian, and Hz stands for Hertz. Alternately, one could express the intensity as the power per unit area per unit solid angle per wavelength interval Iλ. The preferred SI unit for wavelength is meters, so the units of Iλ are W/(m2 sr m). Since the steradian is a pure number and technically has no units, some treatments omit this from the units of intensity. We followed this convention in our Fig. 1, where we plotted Iλ with the units W/m2 m and the wavelength axis is in meters. The two ways of expressing blackbody spectra are very different, and one must always plot Iν versus frequency and Iλ versus wavelength. For instance, the equation for Wein’s law is very different in the two methods.
The Fig. 2 plot has mongrel units. The horizontal linear frequency scale expressed as wavelength is in millimeters, not the SI preferred meters. The vertical scale has the SI preferred W/m2, but the frequency scale is expressed as cm-1 rather than Hertz. As before, this inverse wavelength easily can be converted to the more standard frequency in Hertz. I have no idea why the producers of this plot used such an odd horizontal scale and a non-standard intensity scale. I suspect that it probably has to do with the manner in which the detector operated in the COBE experiment, though it would have been a simple matter for the researchers responsible to convert the scales to more conventional units. One finds a wide range in how the CMB curves from COBE, WMAP, and Planck are plotted. In most cases they are plotted as data points along with a computed blackbody curve of a certain temperature, so the claim that the plots are not true blackbody curves is baseless.
Conclusion
The CMB remains the sole evidence for the big bang theory (Faulkner 2003, pp. 31–34). However, there are several problems with the CMB that call into question its cosmic origin. If the CMB does not have a cosmic origin, then it may be locally generated. If this is the case, then the big bang model is in serious trouble. Naturally, cosmologists will resist this possibility. The recent creation model needs a plausible explanation for the CMB, but recent creationists have yet to suggest one. The proposals to date, emission from dust and an appeal to Eddington’s calculation, are inadequate. Creationists are cautioned to critique properly work on the CMB as evidence for the big bang model. Further work on the CMB within the recent creation model would be most valuable. And we should have the goal of developing a plausible alternate explanation of the CMB within the recent creation paradigm.
Acknowledgment
I thank Colin Michael of the Answers in Genesis IT department for writing the Excel program to compute the various blackbody spectra in the analysis of the Eddington model radiation field.
References
Akridge, R., T. Barnes, and H.S. Slusher. 1981. A recent creation explanation of the 3° K background black body radiation. Creation Research Society Quarterly 18, no. 3:159–162.
Alpher, R. A., and R. C. Herman. 1948a. Evolution of the universe. Nature 162:774–775.
Alpher, R. A., and R. C. Herman. 1948b. On the relative abundance of the elements. Physical Review 74:1737–1742.
Alpher, R. A., and R. C. Herman. 1950. Theory of the origin and relative abundances of the elements and their isotopes. Reviews of Modern Physics 22:153–212.
Alpher, V. S. 2012. Ralph A. Alpher, Robert C. Herman, and the cosmic microwave background radiation. Physics in Perspective 14:300–334.
Assis, A. K. T., and M. C. D. Neves. 1995. History of the 2.7 K temperature prior to Penzias and Wilson. Apeiron 2, no. 3:79–84.
Brown, W. 2008. In the beginning: Compelling evidence for Creation and the Flood. Phoenix, AZ: Center for Scientific Creation.
Byl, J. 2001. God and cosmos: A Christian view of time, space, and the universe. Edinburgh, United Kingdom: Banner of Truth Trust.
Dicke, R. H., R. Beringer, R. L. Kyhl, and A. B. Vane. 1946. Atmospheric absorption measurements with a microwave radiometer. Physical Review 70:340–348.
Dicke, R. H., P. J. E. Peebles, P. G. Roll, and D. T. Wilkinson. 1965. Cosmic background radiation. Astrophysical Journal 142:414–419.
Draine, B.T. 2011. Physics of the interstellar and intergalactic medium. Princeton, New Jersey: Princeton University Press.
Eddington, A. 1926. The internal constitution of the stars. Cambridge, United Kingdom: Cambridge University Press.
Faulkner, D. 2003. Universe by design. Green Forest, Arkansas: New Leaf.
Fixsen, D. J. 2009. The temperature of the cosmic microwave background. The Astrophysical Journal 707, no. 2:916–920.
Gamow, G. 1952. The creation of the universe, p. 42. New York, New York: Viking Press.
Gamow, G. 1956. The physics of the expanding universe. Vistas in Astronomy 2:1726–1732.
Hartnett, J. 2006a. CMB conundrums. Journal of Creation 20, no. 2:10–11.
Hartnett, J. 2006b. The Big Bang fails another test. Journal of Creation 20, no.3:15.
Lisle, J. 2003. Light-travel time: A problem for the big bang. Creation 25, no.4:48–49.
Longair, M. S. 1998. Galaxy formation. Berlin, Germany: Springer-Verlag.
Mather, J. C., E. S. Cheng, R. E. Eplee, R. B. Isaacman, S. S. Meyer, R. A. Shafer, R. Weiss, et al. 1990. A preliminary measurement of the cosmic microwave background spectrum by the Cosmic Background Explorer (COBE) satellite. The Astrophysical Journal 354:L37–L40.
McKellar, A. 1941. Molecular lines from the lowest states of diatomic molecules composed of atoms probably present in interstellar space. Publications of the Dominion Astrophysical Observatory 7, no.15:251–272.
Morris, J. 2003. Is the big bang biblical and 99 other questions. Green Forest, Arkansas: New Leaf.
Penzias, A. A., and R. W. Wilson. 1965. A measurement of excess antenna temperature at 4080 Mc/s. Astrophysical Journal 142:419–421.
Samec, R. 2006. No sign of gravitational lensing in the cosmic microwave background. Journal of Creation 20, no.2:3.
Steidl, P. M. 1983. Comment on the 3° microwave background. Creation Research Society Quarterly 19, no.4:228–230.
Steinhardt, P. J. 2011. The inflation debate. Scientific American 4:36–43.
Williams, A., and J. Hartnett. 2005. Dismantling the big bang. Green Forest, Arkansas: New Leaf.