
The Statistical View of Information
by
Dr. Werner Gitt
on
June 18, 2009
Republished with permission and featured in
In the Beginning Was Information
Shannon’s definition of information entails only one minor aspect of the nature of information, as we will discuss at length.
A1.1 Shannon’s Theory of Information
Claude E. Shannon (born 1916), in his well-known book A Mathematical Theory of Communications [S7, 1948], was the first person to formulate a mathematical definition of information. His measure of information, the “bit” (binary digit), had the advantage that quantitative properties of strings of symbols could be formulated. The disadvantage is just as plain: Shannon’s definition of information entails only one minor aspect of the nature of information, as we will discuss at length. The only value of this special aspect is for purposes of transmission and storage. The questions of meaning, comprehensibility, correctness, and worth or worthlessness are not considered at all. The important questions about the origin (sender) and for whom it is intended (recipient) are also ignored. For Shannon’s concept of information, it is completely immaterial whether a sequence of symbols represents an extremely important and meaningful text, or whether it was produced by a random process. It may sound paradoxical, but in this theory, a random sequence of symbols represents the maximum value of information content—the corresponding value or number for a meaningful text of the same length is smaller.
Shannon’s concept: His definition of information is based on a communications problem, namely to determine the optimal transmission speed. For technical purposes, the meaning and import of a message are of no concern, so that these aspects were not considered. Shannon restricted himself to information that expressed something new, so that, briefly, information content = measure of newness, where “newness” does not refer to a new idea, a new thought, or fresh news—which would have encompassed an aspect of meaning. It only concerns the surprise effect produced by a rarely occurring symbol. Shannon regards a message as information only if it cannot be completely ascertained beforehand, so that information is a measure of the unlikeliness of an event. An extremely unlikely message is thus accorded a high information content. The news that a certain person out of two million participants has drawn the winning ticket, is for him more “meaningful” than if every tenth person stood a chance, because the first event is much more improbable.
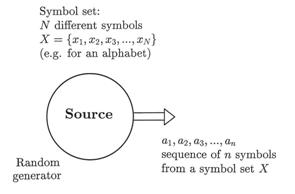
Figure 31: Model of a discrete source for generating sequences of symbols. The source has a supply of N different symbols (e.g., an alphabet with 26 letters), of which a long sequence of n symbols is transmitted one after another at a certain time. The source could be a symbol generator which releases random sequences of symbols according to a given probability distribution, or it could be an unknown text stored on magnetic tape which is transmitted sequentially (i. e. one symbol at a time).
Before a discrete source of symbols (NB: not an information source!) delivers one symbol (Figure 31), there is a certain doubt as to which one symbol ai of the available set of symbols (e.g., an alphabet with N letters a1, a2, a3, . . . , aN) it will be. After it has been delivered, the previous uncertainty is resolved. Shannon’s method can thus be formulated as the degree of uncertainty which will be resolved when the next symbol arrives. When the next symbol is a “surprise,” it is accorded a greater information value than when it is expected with a definite “certainty.” The reader who is mathematically inclined may be interested in the derivation of some of Shannon’s basic formulas; this may contribute to a better understanding of his line of reasoning.
1. The information content of a sequence of symbols: Shannon was only interested in the probability of the appearance of the various symbols, as should now become clearer. He thus only concerned himself with the statistical dimension of information, and reduces the information concept to something without any meaning. If one assumes that the probability of the appearance of the various symbols is independent of one another (e.g., “q” is not necessarily followed by “u”) and that all N symbols have an equal probability of appearing, then we have: The probability of any chosen symbol xi arriving is given by pi = 1/N. Information content is then defined by Shannon in such a way that three conditions have to be met:
i) If there are k independent messages1 (symbols or sequences of symbols), then the total information content is given by Itot = I1+ I2+…+ Ik. This summation condition regards information as quantifiable.
ii) The information content ascribed to a message increases when the element of surprise is greater. The surprise effect of the seldom-used “z” (low probability) is greater than for “e” which appears more frequently (high probability). It follows that the information value of a symbol xi increases when its probability pi decreases. This is expressed mathematically as an inverse proportion: I ~ 1/pi.
iii) In the simplest symmetrical case where there are only two different symbols (e.g., “0” and “1”) which occur equally frequently (pi = 0.5 and p2 = 0.5), the information content I of such a symbol will be exactly one bit.
According to the laws of probability, the probability of two independent events (e.g., throwing two dice) is equal to the product of the single probabilities:
p = p1 x p2 (1)
The first requirement (i) I(p) = I(p1 x p2) = I(p1) + I(p2) is met mathematically when the logarithm of equation (1) is taken. The second requirement (ii) is satisfied when p1 and p2 are replaced by their reciprocals 1/p1 and 1/p2:
I (p1 x p2) = log(1/p1) + log(1/p2). (2)
As yet, the base b of the logarithms in equation (2) entails the question of measure and is established by the third requirement (iii):
I = logb (1/p) = logb (1/0.5) = logb 2 = 1 bit (3)
It follows from logb 2 = 1 that the base b = 2 (so we may regard it as a binary logarithm, as notation we use log2 = lb; giving lb x = (log x)/(log 2); log x means the common logarithm that employs the base 10: log x = log10 x). We can now deduce that the definition of the information content I of one single symbol with probability p of appearing, is
I(p) = lb(1/p) = - lb p ≥ 0. (4)
According to Shannon’s definition, the information content of a single message (whether it is one symbol, one syllable, or one word) is a measure of the uncertainty of its reception. Probabilities can only have values ranging from 0 to 1 (0 ≤ p ≤1), and it thus follows from equation (4) that I(p) ≥ 0, meaning that the numerical value of information content is always positive. The information content of a number of messages (e.g., symbols) is then given by requirement (i) in terms of the sum of the values for single messages
Itot = lb(1/p1) + lb(1/p2) +...+ lb(1/pn) = ∑ lb(1/pi) i=1 (5)
As shown in [G7], equation (5) can be reduced to the following mathematically equivalent relationship:
N Itot = n x ∑ p(xi) x lb(1/(p(xi)) = n x H i=1 (6)
Note the difference between n and N used with the summation sign ∑. In equation (5) the summation is taken over all n members of the received sequence of signs, but in (6) it is summed for the number of symbols N in the set of available symbols.
Explanation of the variables used in the formulas:
n = the number of symbols in a given (long) sequence (e.g., the total number of letters in a book)
N = number of different symbols available (e.g.: N = 2 for the binary symbols 0 and 1, and for the Morse code symbols and –
N = 26 for the Latin alphabet: A, B, C, . . . , Z
N = 26 x 26 = 676 for bigrams using the Latin alphabet: AA, AB, AC, . . . , ZZ
N = 4 for the genetic code: A, C, G, T
xi; i = 1 to N, sequence of the N different symbols
Itot = information content of an entire sequence of symbols
H = the average information content of one symbol (or of a bigram, or trigram; see Table 4); the average value of the information content of one single symbol taken over a long sequence or even over the entire language (counted for many books from various types of literature).
Shannon’s equations (6) and (8) used to find the total (statistical!) information content of a sequence of symbols (e.g., a sentence, a chapter, or a book), consist of two essentially different parts:
a) the factor n, which indicates that the information content is directly proportional to the number of symbols used. This is totally inadequate for describing real information. If, for example, somebody uses a spate of words without really saying anything, then Shannon would rate the information content as very large, because of the great number of letters employed. On the other hand, if someone who is an expert, expresses the actual meanings concisely, his “message” is accorded a very small information content.
b) the variable H, expressed in equation (6) as a summation over the available set of elementary symbols. H refers to the different frequency distributions of the letters and thus describes a general characteristic of the language being used. If two languages A and B use the same alphabet (e.g., the Latin alphabet), then H will be larger for A when the letters are more evenly distributed, i.e., are closer to an equal distribution. When all symbols occur with exactly the same frequency, then H = lb N will be a maximum.
An equal distribution is an exceptional case: We consider the case where all symbols can occur with equal probability, e.g., when zeros and ones appear with the same frequency as for random binary signals. The probability that two given symbols (e.g., G, G) appear directly one after the other, is p2; but the information content I is doubled because of the logarithmic relationship. The information content of an arbitrary long sequence of symbols (n symbols) from an available supply (e.g., the alphabet) when the probability of all symbols is identical, i.e.:
p1= p2 = ... = pN= p, is found from equation (5) to be:
n Itot = ∑ lb(1/pi) = n x lb(1/p) = -n x lb p. i=1 (7)
If all N symbols may occur with the same frequency, then the probability is p = 1/N. If this value is substituted in equation (7), we have the important equation:
Itot = n x lb N = n x H. (8)
2. The average information content of one single symbol in a sequence: If the symbols of a long sequence occur with differing probabilities (e.g., the sequence of letters in an English text), then we are interested in the average information content of each symbol in this sequence, or the average in the case of the language itself. In other words: What is the average information content in this case with relation to the average uncertainty of a single symbol?
To compute the average information content per symbol Iave, we have to divide the number given by equation (6) by the number of symbols concerned:
N Iave = Itot/n = ∑ p(xi) x lb(1/p(xi)). i=1 (9)
When equation (9) is evaluated for the frequencies of the letters occurring in English, the values shown in Table 1 are obtained. The average information content of one letter is Iave = 4.045 77. The corresponding value for German is Iave = 4.112 95.
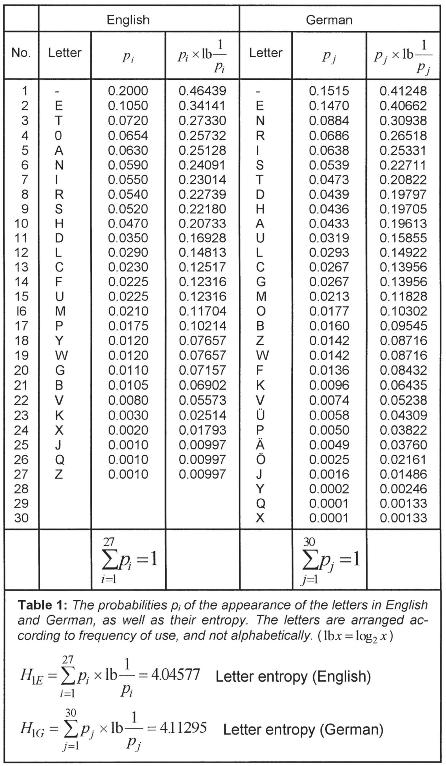
The average Iave (x) which can be computed from equation (9) thus is the arithmetic mean of the all the single values I(x). The average information content of every symbol is given in Table 1 for two different symbol systems (the English and German alphabets); for the sake of simplicity i is used instead of Iave. The average information content for each symbol Iave(x) ≡ i is the same as the expectation value2 of the information content of one symbol in a long sequence. This quantity is also known as the entropy3 H of the source of the message or of the employed language (Iave ≡ i ≡ H). Equation (9) is a fundamental expression in Shannon’s theory. It can be interpreted in various ways:
a) Information content of each symbol: H is the average information content Iave(x) of a symbol xi in a long sequence of n symbols. H thus is a characteristic of a language when n is large enough. Because of the different letter frequencies in various languages, H has a specific value for every language (e.g., H1 = 4.045 77 for English and for German it is 4.112 95).
b) Expectation value of the information content of a symbol: H can also be regarded as the expectation value of the information content of a symbol arriving from a continuously transmitting source.
c) The mean decision content per symbol: H can also be regarded as the mean decision content of a symbol. It is always possible to encode the symbols transmitted by a source of messages into a sequence of binary symbols (0 and 1). If we regard the binary code of one symbol as a binary word, then H can also be interpreted as follows (note that binary words do not necessarily have the same length): It is the average word length of the code required for the source of the messages. If, for instance, we want to encode the four letters of the genetic code for a computer investigation and the storage requirements have to be minimized, then H will be lb 4 = 2 binary positions (e.g., 00 = A, 01 = C, 10 = G, and 11 = T).
d) The exceptional case of symbols having equal probabilities: This is an important case, namely that all N symbols of the alphabet or some other set of elements occur with the same probability p(xi) = 1/N. To find the mean information content of a single symbol, we have to divide the right side of equation (8) by n:
H ≡ Iave(x) ≡ i = lb N (10)
We now formulate this statement as a special theorem:
Theorem A1: In the case of symbol sequences of equal probability (e.g., the digits generated by a random number generator) the average information content of a symbol is equal to the information content of each and every individual symbol.
A1.2 Mathematical Description of Statistical Information
A1.2.1 The Bit: Statistical Unit of Information
One of the chief concerns in science and technology is to express results as far as possible in a numerical form or in a formula. Quantitative measures play an important part in these endeavors. They comprise two parts: the relevant number or magnitude, and the unit of measure. The latter is a predetermined unit of comparison (e.g., meter, second, watt) which can be used to express other similarly measurable quantities.
The bit (abbreviated from binary digit) is the unit for measuring information content. The number of bits is the same as the number of binary symbols. In data processing systems, information is represented and processed in the form of electrical, optical, or mechanical signals. For this purpose, it is technically extremely advantageous, and therefore customary, to employ only two defined (binary) states and signals. Binary states have the property that only one of the two binary symbols can be involved at a certain moment. One state is designated as binary one (1), and the other as binary nought (0). It is also possible to have different pairs of binary symbols like 0 and L, YES and NO, TRUE and FALSE, and 12 V and 2 V. In computer technology, a bit also refers to the binary position in a machine word. The bit is also the smallest unit of information that can be represented in a digital computer. When text is entered in a computer, it is transformed into a predetermined binary code and also stored in this form. One letter usually requires 8 binary storage positions, known as a byte. The information content (= storage requirement) of a text is then described in terms of the number of bits required. Different pieces of text are thus accorded the same information content, regardless of sense and meaning. The number of bits only measures the statistical quantity of the information, with no regard to meaningfulness.
Two computer examples will now illustrate the advantages (e.g., to help determine the amount of storage space) and the disadvantages (e.g., ignoring the semantic aspects) of Shannon’s definition of information:
Example 1: Storage of biological information: The human DNA molecule (body cell) is about 79 inches (2 m) long when fully stretched and it contains approximately 6 x 10⁹ nucleotides (the chemical letters: adenin, cytosin, guanin, and thymin). How much statistical information is this according to Shannon’s defintion? The N = 4 chemical letters, A, C, G, and T occur nearly equally frequently; their mean information content is H = lb 4 = (log 4)/(log 2) = 2 bits. The entire DNA thus has an information content of Itot = 6 x 10⁹ nucleotides x 2 bits/nucleotide = 1.2 x 1010 bits according to equation (10). This is equal to the information contained in 750,000 typed A4 pages each containing 2,000 characters.
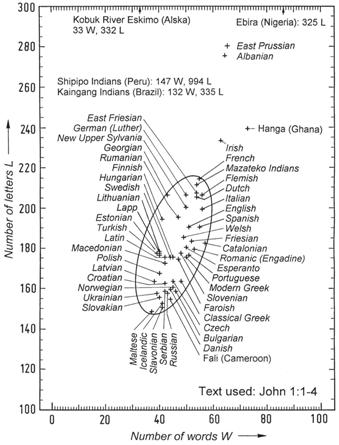
Figure 32: The number of letters L and words W illustrating statistical properties of various languages.
Example 2: The statistical information content of the Bible: The King James Version of the English Bible consists of 3,566,480 letters and 783,137 words [D1]. When the spaces between words are also counted, then n = 3,566,480 + 783,137 - 1 = 4,349,616 symbols. The average information content of a single letter (also known as entropy) thus amounts to H = 4.046 bits (see Table 1). The total information content of the Bible is then given by Itot = 4,349,616 x 4.046 = 17.6 million bits. Since the German Bible contains more letters than the English one, its information content is then larger in terms of Shannon’s theory, although the actual contents are the same as regards their meaning. This difference is carried to extremes when we consider the Shipipo language of Peru which is made up of 147 letters (see Figure 32 and Table 2). The Shipipo Bible then contains about 5.2 (= 994/191) times as much information as the English Bible. It is clear that Shannon’s definition of information is inadequate and problematic. Even when the meaning of the contents is exactly the same (as in the case of the Bible), Shannon’s theory results in appreciable differences. Its inadequacy resides in the fact that the quantity of information only depends on the number of letters, apart from the language-specific factor H in equation (6). If meaning is considered, the unit of information should result in equal numbers in the above case, independent of the language.
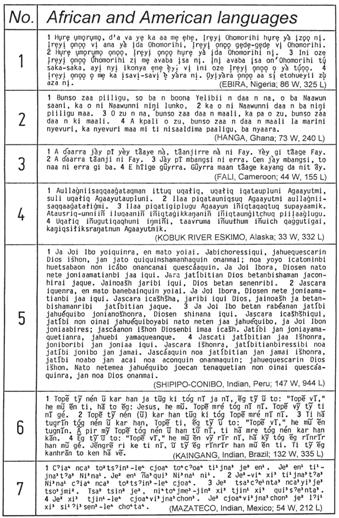
Table 2: John 1:1–4 in different languages. (The author is sincerely grateful for the Bible texts made available by Mr. A. Holzhausen, Wycliffe Bible translator, Burbach/Germany.)
The first four verses of the Gospel of John is rendered in three African and four American languages in Table 2. In my book So steht’s geschrieben [It Is Written, G12, p. 95–98] the same verses are given in 47 different European languages for purposes of comparison. The annotation “86 W, 325 L” means that 86 words and 325 letters are used. The seventh language in Table 2 (Mazateco) is a tonal language. The various values of B and L for John 1:1–4 are plotted for 54 languages in Figure 32. These 54 languages include 47 European languages (italics) and seven African and American languages. It is remarkable that the coordinates of nearly all European languages fall inside the given ellipse. Of these, the Maltese language uses the least number of words and letters, while the Shipipo Indians use the largest number of letters for expressing the same information.
The storage requirements of a sequence of symbols should be distinguished from its information content as defined by Shannon. Storage space is not concerned with the probability of the appearance of a symbol, but only with the total number of characters. In general, 8 bits (= 1 byte) are required for representing one symbol in a data processing system. It follows that the 4,349,616 letters and spaces (excluding punctuation marks) of the English Bible require eight times as many bits, namely 34.8 million.
A1.2.2 The Information Spiral
The quantities of information of a large number of examples from languages, everyday events, electronic data processing, and biological life, are given in Table 3 in terms of bits. A graphical representation of the full range of values requires more than 24 orders of magnitude (powers of ten), so that a logarithmic spiral has been chosen here. A selection of values from Table 3 is represented in Figure 33 where each scale division indicates a tenfold increase from the previous one.
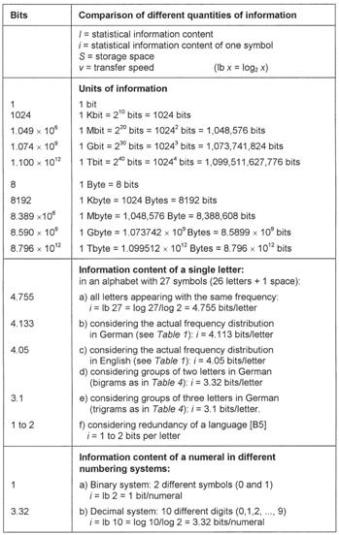
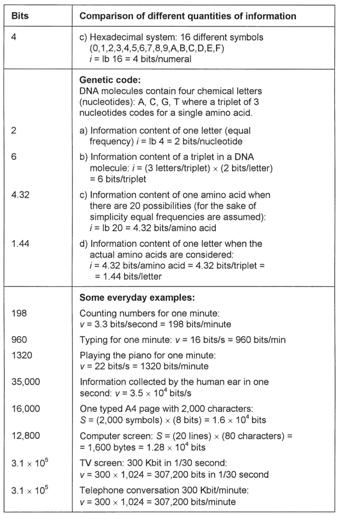
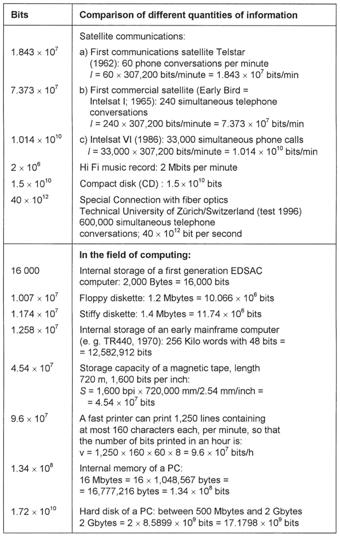
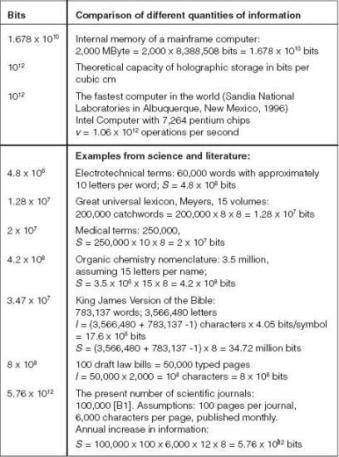
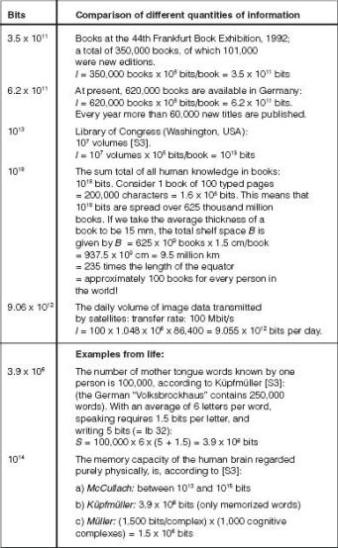
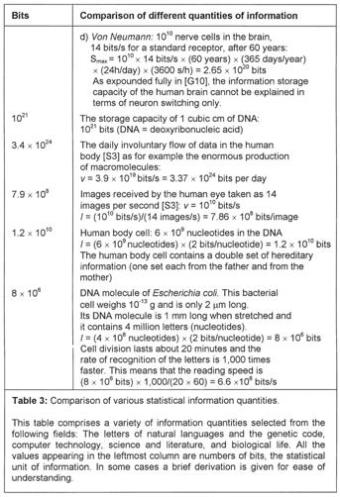
Table 3: Examples of quantities of information in terms of bits.

Figure 34: The ant and the microchip. Microchips are the storage elements of present-day computers. Their details are practically invisible, since structure widths are about one millionth of a meter. What a 30-ton computer of the University of Pennsylvania (USA) could do in 1946 can now be accomplished by a chip less than 6 square mm in size. Only a few years ago, chips which could store the text of four typed pages were regarded as revolutionary. Today, all the telephone numbers of a city like Canberra, Australia, can be stored on one chip, and their speed of operation is so fast that the Bible could be read 200 times in one second, but there is one thing that all the chips in the world will never be able to do, namely to copy an ant and all it can do. (Source: “Werkbild Philips”; with the kind permission of “Valvo Unternehmens-bereichs Bauelemente” of Philips GmbH, Hamburg.)
Two different information ranges are illustrated in Figure 34, namely biological information as stored in DNA molecules — represented by the ant — and a microchip as used in the latest computers.
1. Computer technology: Konrad Zuse (1910–1996), a German inventor, pioneered the concept of a program-driven computer when he built the first operational electrical computing machine Z3 in 1941. It utilized 600 telephone relays for calculations, and 2,000 relays for storage. It could store 64 numbers in every group of 22 binary positions, could perform between 15 and 20 arithmetic operations per second, and one multiplication required 4 to 5 seconds. The next advance was the introduction of vacuum tubes (first generation electronic computers), and the ENIAC computer became operational in 1946. It had more than 18,000 vacuum tubes and other components wired together by means of more than half a million soldered connections. One addition operation required 0.2 thousandths of a second and a multiplication could be performed in 2.8 thousandths of a second. This installation utilized a word length4 of 10 decimal places, it weighed 30 tons, and consumed 150 kW of electrical power. After several years of research, transistors were invented in 1947. They were much smaller and faster than vacuum tubes, and their introduction as switching elements initiated the second computer generation in 1955. The next milestone on the way leading to the powerful computers of today was the idea of integrated circuits (ICs). Different components are incorporated and interconnected in similar-looking units made of the same materials. The first IC was made in 1958, based on the novel integration idea proposed by Kilby and Hoerni. Further development of this concept, and the steady increase in the number of circuit elements per silicon chip, saw the advent of the third computer generation. ICs have undergone a rapid development since the first simple ones introduced in 1958. Today, 64-Megabit chips are commonplace.
Five degrees of integration can be distinguished according to the number of components per structural unit:
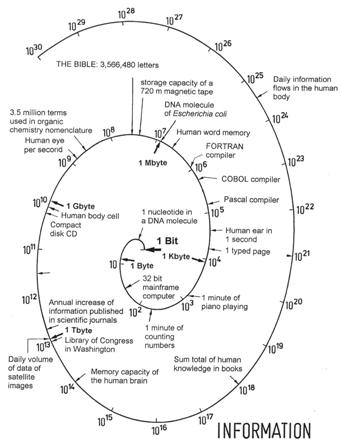
Figure 33: The information spiral.
SSI (Small Scale Integration) 1 to 10
MSI (Medium Scale Integration) 10 to 103
LSI (Large Scale Integration) 103 to 104
VLSI (Very Large Scale Integration) 104 to 106
GSI (Grand Scale Integration) 106 and upward
High levels of integration, where between 500 and 150,000 transistors are accommodated on one silicon chip having an area of between 5 and 30 mm2, led to the development of microprocessors. This technology made it possible to have complete processing or storage units on a single chip. The number of circuits that can be integrated on one chip doubled approximately every second year. The first experimental chip capable of storing more than one million bits (1 Megabit = 220 bits = 1,048,576 bits), was developed in 1984 by IBM. The silicon wafer used measured 10.5 mm x 7.7 mm = 80.85 mm2, so that the storage density was 13,025 bits per square mm. The time required to access data on this chip was 150 nanoseconds (1 ns = 10-9 s). The degree of integration increased steadily in subsequent years.
The question arises whether the density of integration could be increased indefinitely. In an article in Elektronische Rechenanlagen (Electronic Computers) [F4], O.G. Folberth pointed out the obstacles that would have to be overcome in future developments. Such hurdles in manufacturing technology, complexity of design, and testing problems, are, however, not fundamental, but there are hard physical boundaries of a final nature which would be impossible to overcome (geometric, thermic, and electrical limits). The maximum integration density which can be achieved with present-day silicon technology, can be calculated; it is found to be 2.5 x 10⁵ lattice units per mm2.
The improvement of hardware elements made it possible for computer terminals and personal computers to be as powerful as earlier mainframe computers. One of the fastest computers made is the CRAY C916/16, one of the C-90 series. The processing speed of this 16 processor computer is about 10 GFLOPS (= 10 Giga-FLOPS). One FLOPS (floating point operations per second) means that one computation involving real numbers with floating decimal signs, can be executed in one second; 10 GFLOPS is thus equal to 10 thousand million arithmetic calculations like addition and multiplication performed in one second.
2. Degree of integration in living cells: We have now been represented with an astounding development involving the increasing degree of integration (number of circuit elements in one chip) and the integration density (degree of miniaturization; circuit elements per area unit) as seen in computer technology. There is no precedent for such a rapid and unique development in any other field of technology.
The information stored in the DNA molecules of all living cells is indispensable for the numerous guided processes involving complex and unique functions. The human DNA molecule (body cells) is about 79 inches (2 m) long when stretched, and it contains 6 x 10⁹ chemical letters. We may well ask what the packing density of this information could be, and it is fairly easy to calculate. According to Table 3, the information content of one nucleotide is two bits, giving a total of 12 x 109 bits for one DNA molecule. Divide this by the number of bits in one Kbit (1024); this results in a degree of integration of 11.72 million Kbits, which is 180 times as much as the above-mentioned 64 Megabit chip. The density of integration is discussed more fully in the next section.
This comparison makes it patently clear that the evolutionary view requires us to believe things which are totally unreasonable. Thousands of man-years of research as well as unprecedented technological developments were required to produce a Megabit chip, but we are expected to believe that the storage principles embodied in DNA, with their much higher degree of integration, developed spontaneously in matter which was left to itself. Such a “theory” is, to say the least, absurd in the highest degree!
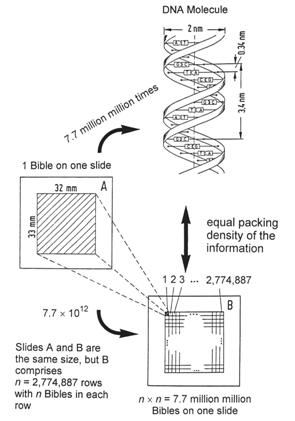
Figure 35: Comparison of statistical information densities. DNA molecules contain the highest known packing density of information. This exceedingly brilliant storage method reaches the limit of the physically possible, namely down to the level of single molecules. At this level the information density is more than 1021 bits per cm3. This is 7.7 million million times the density obtained when the entire Bible is reproduced on one photographic slide A. Only if 7.7 million million Bibles could be represented on one slide B (this is only theoretically possible!), having 2.77 million rows and 2.77 million columns with the entire Bible reproduced in each miniscule rectangle, would we obtain an information packing density equal to that present in all living cells.
A1.2.3 The Highest Packing Density of Information
The greatest known density of information is that in the DNA of living cells. The diameter of this chemical storage medium, illustrated in Figure 35, is 2 nm = 2 x 10⁻⁹ m, and the spiral increment of the helix is 3.4 nm (Greek hélix = winding, spiral). The volume of this cylinder is V = h x d2 x π /4:
V = 3.4 x 10-7 cm x (2 x 10-7 cm)2 x π/4 = 10.68 x 10⁻²¹ cm3 per winding
There are 10 chemical letters (nucleotides) in each winding of the double spiral, giving a statistical information density of:
Ú = 10 letters/(10.68 x 10-21 cm3) = 0.94 x 10²¹ letters per cm3
If we limit the average information content of 4.32 bits for an amino acid (see chapter 6) to one letter (nucleotide) of the genetic code, then we find it to be 4.32:3 = 1.44 bits per letter. We can now express the statistical information density of DNA as follows, where 2 bits are taken as the information content of one letter (also see Table 3, genetic code, case a):
Ú = (0.94 x 10²¹ letters/cm3) x (2 bits/letter) = 1.88 x 1021 bits/cm3
This packing density is so inconceivably great that we need an illustrative comparison. The photographic slide A in Figure 35 contains the entire Bible from Genesis to Revelation on its 33 mm x 32 mm surface, reproduced by means of special microfilm processes [M5]. From the computation given in [G11, p. 78–81], it follows that the DNA molecule entails a storage density 7.7 million million times as great as that of slide A which contains the entire Bible. If we want to obtain the DNA packing density on a photographic slide B, we would have to divide its surface into 2.77 million rows and 2.77 million columns and copy an entire Bible in a readable form in each of the tiny rectangles formed in this way. If this were possible, we would have reached the density of the information carried in each and every living cell. In any case, we should remember that it is technologically impossible to produce slide B, because all photographic techniques are limited to macroscopic reproductions and are unable to employ single molecules as units of storage. Even if it were possible to achieve such a photographic reduction, then we would still only have a static storage system, which differs fundamentally from that of DNA. The storage principle of DNA molecules is dynamic, since the contained information can be transferred unchanged to other cells by means of complex mechanisms.
These comparisons illustrate in a breathtaking way the brilliant storage concepts we are dealing with here, as well as the economic use of material and miniaturization. The highest known (statistical) information density is obtained in living cells, exceeding by far the best achievements of highly integrated storage densities in computer systems.
A1.3 Evaluation of Communication Systems
Technical communication systems: After the discussion of Shannon’s definition of information in paragraph A1.1, the relevant question is: What is the use of a method which ignores the main principles of a phenomenon? The original and the most important application of Shannon’s information theory is given by the two socalled encoding theorems [S7]. These theorems state, inter alia, that in spite of the uncertainty caused by a perturbed communication link, the reception of a message could be certain. In other words, there exists an error-correcting method of encoding which assures greater message security with a given block (message) length.
Furthermore, the unit of measure, the bit, derived from Shannon’s definition of information, is fundamental to a quantitative assessment of information storage. It is also possible, at the statistical level, to compare directly given volumes of information which are encoded in various ways. This problem has been discussed fully in the previous paragraph A1.2.
Communication systems in living organisms: Bernhard Hassenstein, a German biologist and cyberneticist, gave an impressive example illustrating both the brilliant concept of information transfer in living organisms, and its evaluation in terms of Shannon’s theory:
It is difficult, even frightening, to believe that the incomparable multiplicity of our experiences, the plethora of nuances—lights, colors, and forms, as well as the sounds of voices and noises . . . all the presentations of these in our sense receptor cells, are translated into a signaling language which is more monotonous than Morse code. Furthermore, this signaling language is the only basis through which the profusion of inputs is made alive in our subjective perception again — or for the first time. All our actions and activities are also expressed in this signaling language, from the fine body control of athletes to the hand movements of a pianist or the mood expressions of a concert hall performer.
Whatever we experience or do, all the impulses coursing through our nervous system from the environment to our consciousness and those traveling from our brain to the motor muscles, do so in the form of the most monotonous message system imaginable. The following novel question was only formulated when a scientific information concept had been developed, namely, what is the functional meaning of selecting a signaling language using the smallest number of symbols for the transmission of such a vast volume of information? This question could be answered practically immediately by means of the information concept of information theory.
The British physiologist W.H. Rushton was the first person to provide the answer which greatly surprised biologists, namely: There exists a result in information theory for determining the capacity of a communication system in such a way that its susceptibility to perturbating interference is minimized. This is known as the method of standardization of the properties of the impulses. The technique of pulse code modulation was discovered in the 1930s, but its theoretical principles were only established later. The symbolic language employed in living nervous systems corresponds exactly to the theoretical ideal of interference-free communication. It is impossible to improve on this final refinement of pulse code modulation, and the disadvantage of a diminished transmission capacity is more than offset by the increase in security. The monotonousness of the symbolic language of the nervous system thus convincingly establishes itself as expressing the highest possible freedom from interference. In this way, a very exciting basic phenomenon of physiology could be understood by means of the new concepts of information theory.
It should now be clear that Shannon’s information theory is very important for evaluating transmission processes of messages, but, as far as the message itself is concerned, it can only say something about its statistical properties, and nothing about the essential nature of information. This is its real weakness as well as its inherent propensity for leading to misunderstandings. The German cyberneticist Bernhard Hassenstein rightly criticizes it in the following words: “It would have been better to devise an artificial term, rather than taking a common word and giving it a completely new meaning.” If we restrict Shannon’s information to one of the five aspects of information, then we do obtain a scientifically sound solution [G5]. Without the extension to the other four levels of information, we are stuck with the properties of a transmission channel. No science, apart from communication technology, should limit itself to just the statistical level of information.
Natural languages may be analyzed and compared statistically by means of Shannon’s theory, as we will now proceed to do.
A1.4 Statistical Analysis of Language
It is possible to calculate certain quantitative characteristics of languages by means of Shannon’s information theory. One example of such a property is the average information content of a letter, a syllable, or a word. In equation (9), this numerical value is denoted by H, the entropy.
1. Letters: If, for the sake of simplicity, we assume that all 26 letters plus the space between words occur with the same frequency, then we have:
H0 = lb 27 = log 27/log 2 = 4.755 bits/letter (11)
It is known that the frequency of occurrence of the different letters is characteristic of the language we are investigating [B2 p 4]. The probability pi of occurrence of single letters and the space are given for English and German in Table 1, as well as the average information content per letter, H. On applying equation (9) to the various letter frequencies Pi in German, the average information content (= entropy) of a symbol is given by:
30 H1= ∑ pi x lb(1/pi) = 4.112 95 bits/letter i=1 (12)
The corresponding value for English is H1 = 4.04577 bits per letter. We know that the probability of a single letter is not independent of the adjacent letters. Q is usually followed by u, and, in German, n follows e much more frequently than does c or z. If we also consider the frequency of pairs of letters (bigrams) and triplets (trigrams), etc., as given in Table 4, then the information content as defined by Shannon, decreases statistically because of the relationships between letters, and we have:
H0> H1> H2> H3> H4> ... > H∞ (13)
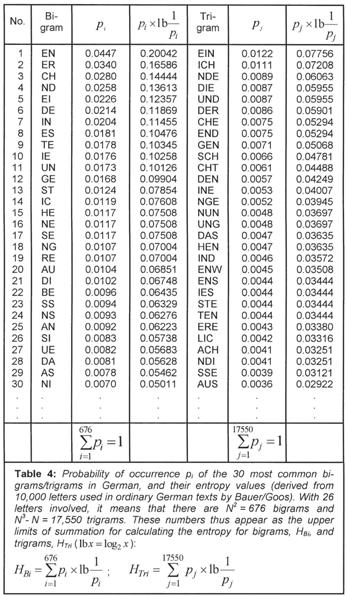
With 26 letters, the number of possible bigrams is 262 = 676, and there could be 263 - 26 = 17,550 trigrams, since three similar letters are never consecutive. Taking all statistical conditions into consideration, Küpfmüller [K4] obtained the following value for the German language:
H∞ = 1.6 bits/letter (14)
For a given language, the actual value of H0 is far below the maximum value of the entropy. The difference between the maximum possible value Hmax and the actual entropy H, is called the redundance R. The relative redundance is calculated as follows:
r = (Hmax -H)/Hmax (15)
For written German, r is given by (4.755 – 1.6)/4.755 = 66%. Brillouin obtained the following entropy values for English [B5]:
H1 = 4.03 bits/letter
H2 = 3.32 bits/letter
H3 = 3.10 bits/letter
H∞ = 2.14 bits/letter
We find that the relative redundance for English, r = (4.755 - 2.14)/4.755 = 55% is less than for German. In Figure 32 the redundancy of a language is indicated by the positions of the different points.
Languages usually employ more words than are really required for full comprehensibility. In the case of interference, certainty of reception is improved because messages usually contain some redundancy (e.g., illegibly written words, loss of signals in the case of a telegraphic message, or when words are not pronounced properly).
2. Syllables: Statistical analyses of the frequencies of German syllables have resulted in the following value for the entropy when their frequency of occurrence is taken into account [K4]:
Hsyll = 8.6 bits/syllable (16)
The average number of letters per syllable is 3.03, so that
H3 = 8.6/3.03 = 2.84 bits/letter. (17)
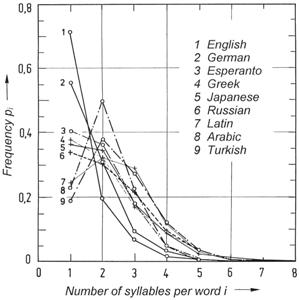
Figure 36: Frequency distributions p(i) for various languages, from which the average number of syllables per word can be derived. When a long enough text in a language is investigated, a characteristic frequency of the number of syllables per word is found. For many languages, monosyllabic words occur most frequently (e.g., English, German, and Greek), but for other languages, bisyllabic words are most common (e.g., Latin, Arabic, and Turkish).(pi = relative frequency of occurrence of words consisting of i syllables; i = average number of syllables per word.)
W. Fucks [F9] investigated the number of syllables per word, and found interesting frequency distributions which determine characteristic values for different languages.
The average number of syllables per word is illustrated in Figure 36 for some languages. These frequency distributions were obtained from fiction texts. We may find small differences in various books, but the overall result does not change. In English, 71.5% of all words are monosyllabic, 19.4% are bisyllabic, 6.8% consist of three syllables, 1.6% have four, etc. The respective values for German are 55.6%, 30.8%, 9.38%, 3.35%, 0.71%, 0.14%, 0.2%, and 0.01%.
For English, German, and Greek, the frequency distribution peaks at one syllable, but the modus for Arabic, Latin, and Turkish is two syllables (Figure 36). In Figure 37, the entropy HS ≡ Hsyllable is plotted against the average number of syllables per word for various languages. Of the investigated languages, English has the smallest number of syllables per word, namely 1.4064, followed by German (1.634), Esperanto (1.895), Arabic (2.1036), Greek (2.1053), etc. The average ordinate values for syllable entropy Hsyllable of the different languages have been found by means of equation (9), but it should be noted that the probabilities of occurrence of monosyllabic, bisyllabic, etc. words were used for pi. The value of Hsyllable = 1.51 found for German, should not be compared with the value derived from equation (16), because a different method of computation is used.
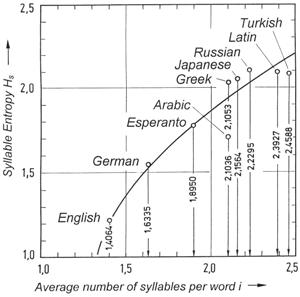
Figure 37: Statistical characteristics of various languages. Using equation 9, we may calculate the average information content per syllable, Hs, for a given language. This value is peculiar to the language, and when the various values are plotted, we obtain the distribution shown in this diagram.
3. Words: Statistical investigations of German showed that half of all written text comprises only 322 words [K4]. Using these words, it follows from equation (9) that the word entropy, Hword = 4.5 bits/word. When only the 16 most frequently used words, which already make up 20% of a text, are considered, Hword is found to be 1.237 bits per word. When all words are considered, we obtain the estimated 1.6 bits per letter, as indicated in equation (14). The average length of German words is 5.53 letters, so that the average information content is 5.53 x 1.6 = 8.85 bits per word.
It should now be clear that certain characteristics of a language may be described in terms of values derived from Shannon’s theory of information. These values are purely of a statistical nature, and do not tell us anything about the grammar of the language or the contents of a text. Just as the effective current Ieff of a continually changing electrical input (e.g., as a control parameter in a complex technological experiment) could be calculated as a statistical characteristic, it is also possible to establish analogous linguistic properties for languages. Just as Ieff can say nothing about the underlying control concepts, so such linguistic characteristics have no semantic relevance.
A1.5 Statistical Synthesis of Language
After having considered statistical analyses of languages in the previous section, the question now arises whether it would be possible to generate, by purely random combinations of symbols:
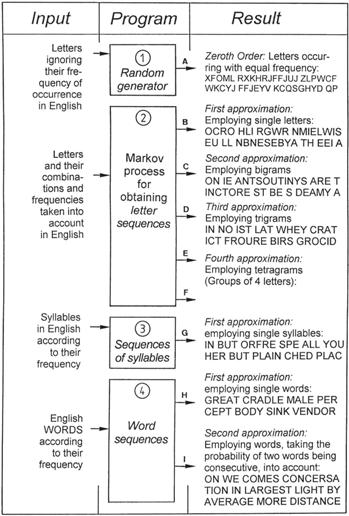
Figure 38: “Language synthesis” experiments for determining whether information can arise by chance. Sequences of letters, syllables, and words (including spaces) are obtained by means of computer programs. The letters, all combinations of letters, syllables, and words (a complete German lexicon) were used as inputs. Their known frequencies of occurrence in German texts are fully taken into account in this “language synthesis.” The resulting random sequences A to I do not comprise information, in spite of the major programming efforts required. These sequences are semantic nonsense, and do not correspond with any aspect of reality.
a) correct sentences in a given language
b) information (in the fullest sense of the concept)
Our point of departure is Figure 38. Random sequences of symbols can be obtained by means of computer program (1). When the letters may occur with equal frequency, then sequences of letters (output A in Figure 38) are obtained which do not at all reflect the simplest statistical characteristics of German or English or any other language. Seen statistically, we would never obtain a text which would even approximately resemble the morphological properties of a given language.
One can go a step further by writing a program (2), which takes the actual frequency of letter combinations of a language into consideration (German in this case). It may happen that the statistical links between successive letters are ignored, so that we would have a first order approximation. Karl Küpfmüller’s [K4] example of such a sequence is given as output B, but no known word is generated. If we now ensure that the probabilities of links between successive letters are also accounted for, outputs C, D, and E are obtained. Such sequences can be found by means of stochastic Markov processes, and are called Markov chains.
Program (2) requires extensive inputs which take all the groups of letters (bigrams, trigrams, etc.) appearing in Table 4 into account, as well as their probability of occurrence in German. With increased ordering, synthetic words arise, some of which can be recognized as German words, but structures like “gelijkwaardig,” “ryljetek,” and “fortuitousness” are increasingly precluded by the programming. What is more, only a subset of the morphologically typical German sounding groups like WONDINGLIN, ISAR, ANORER, GAN, STEHEN, and DISPONIN are actual German words. Even in the case of the higher degree approximations one cannot prevent the generation of words which do not exist at all in speech usage.
A next step would be program (3) where only actual German syllables and their frequency of occurrence are employed. Then, in conclusion, program (4) prevents the generation of groups of letters which do not occur in German. Such a program requires a complete dictionary to be stored, and word frequencies are also taken into account (first approximation). As a second approximation, the probability of one word following another is also considered. It should be noted that the programs involved, as well as the voluminous data requirements, comprise many ideas, but even so, the results are just as meager as they are unambiguous: In all these cases we obtain “texts” which may be morphologically correct, but are semantic nonsense.
A word is not merely a sequence of letters, but it has a nomenclatorial function which refers to a specific object (e.g., Richard the Lion Heart, Matterhorn, or London) or a class of objects (animal, car, or church) according to the conventions of the language. Every language has its own naming conventions for the same object, as for example “HOUSE,” German “HAUS,” Spanish “CASA,” French “MAISON,” and Finnish “TALON.” In addition, a single word also has a meaning in the narrow sense of the word.
On the other hand, a sentence describes a situation, a condition, or an event, i.e., a sentence has an overall meaning. It consists of various single words, but the meaning of a sentence comprises more than just a sequential chain of the meanings of the words. The relationships between the sense of a sentence and the meanings of the words it contains are a semantic problem which can only be investigated in the framework of the delicately shaded meanings of the language conventions existing between the sender and the recipient of the message.
Conclusion: Even though complete sets of letter groups, syllables, and words are used, together with their previously established frequency distributions, the statistically produced texts generated by various programming systems lack the decisive criteria which would ensure that a sequence of letters comprises a real message. The following criteria have to be met before a sequence of symbols can be accorded the status of information (a message):
1. Meaning accorded by the sender: A set of symbols must have been transmitted by a sender and must be directed at a recipient. (If the described process did generate a letter sequence like “I LOVE YOU,” I would be able to understand the text, but it still is not information as far as I am concerned, because it was not transmitted by somebody who loves me.)
2. Truth based in reality: The set of symbols must contain actual truth pertaining to the real world. (If a statistical process might produce a sentence like “PARIS IS THE CAPITAL OF FRANCE,” this is correct and true, but it has no practical significance, because it is not rooted in a real experience.)
3. Recognizable intention: A sequence of symbols must be purposefully intentional, i.e., it must have been conceptualized by a sender.
4. Oriented toward a recipient: The sequence of symbols must be addressed to or directed at somebody. (When a letter or a telegram is dispatched, the sender has a very definite recipient in mind; a book has a certain specific readership; when a bee performs a food dance, important information is conveyed to the other bees in the hive; DNA information is transferred to RNA which then leads to protein synthesis.) Recipient orientation is also involved even when there is a captive audience in addition to the intended recipient (e.g., unintentional listening in to a conversation in a train compartment).
Theorem A2: Random letter sequences or sequences produced by statistical processes do not comprise information. Even if the information content could be calculated according to Shannon’s theory, the real nature of information is still ignored.
In the historical debate in Oxford in 1860 between Samuel Wilberforce (1805–1873) and the Darwinist Thomas H. Huxley (1825–1895), the latter stated that if monkeys should strum typewriters randomly for a long enough time, then Psalm 23 would emerge sooner or later. Huxley used this argument to demonstrate that life could have originated by chance, but this question is easily resolved by means of the information theorems. It follows from the theorems mentioned in chapter 4 and from Theorem A2 that information is not at all involved. The comparison invoked by Huxley has no bearing on information nor on life. The properties of information discussed in chapter 5, show that Huxley spoke about random sequences, but information was not involved in this argument about monkeys typing. It is impossible for information to originate in matter by random processes (see Theorem 1).
Questions a) and b) raised above, can now be answered unambiguously:
—It is only possible to synthesize, by means of a statistical process, correct sentences obeying the conventions of a given language, if the required know-how is included beforehand in the data (valid morphemes, syllables, and words) and in the programs. These programs require enormous efforts, and it is then even possible to generate sentences which obey the syntactical rules of the language. Even if some meaning could be ascribed to a sequence of words obtained in this way, it can still not be regarded as having “message quality,” because it originated in a random process.
—Statistical processes cannot generate real information or real messages.
In the Beginning Was Information

Between the covers of this book may well be the most devastating scientific argument against the idea that life could form by natural processes.
Read Online
Master Books has graciously granted AiG permission to publish selected chapters of this book online. To purchase a copy please visit our online store.
Footnotes
- Message: In Shannon’s theory, a message is not necessarily meaningful, but it refers to a symbol (e.g., a letter) or a sequence of symbols (e.g., a word). In this sense, the concept of a “message” is even included in the DIN standards system, where it is encoded as 44 300: “Symbols and continuous functions employed for the purpose of transmission, which represent information according to known or supposed conventions.”
- Expectation value: The expectation value E is a concept which is defined for random quantities in probability calculus. The sum ∑ pk x g(xk) taken over all k single values, is called the expectation value E of the probability distribution, where g(x) is a given discrete distribution with xk as abscissae and pk as ordinates (= the probability of appearance of the values xk). This value is also known as the mean value or the mathematical hope.
- Entropy: This concept was first introduced in thermodynamics by Rudolf Clausius about 1850. Later, in 1877, Ludwig Boltzmann (1844–1906) showed that entropy is proportional to the logarithm of the probability of a system being in a certain state. Because the formal derivation of the mathematical formulas for physical entropy is similar to equation (9), Shannon (1948) also called this quantity entropy. Unfortunately, the use of the same term for such fundamentally different phenomena has resulted in many erroneous conclusions. When the second law of thermodynamics, which is also known as the entropy theorem, is flippantly applied to Shannon’s information concept, it only causes confusion. In thermodynamics, entropy depends on the temperature, which cannot at all be said of informational entropy.
- Word length: A set of bits which is processed as a unit is called a word. The range of numbers which can be handled, as well as the number of data storage locations which can be addressed, depends on the length and the structure of the word (see also Table 3).

Support the creation/gospel message by donating or getting involved!

Answers in Genesis is an apologetics ministry, dedicated to helping Christians defend their faith and proclaim the good news of Jesus Christ.
- Customer Service 800.778.3390
- Available Monday–Friday | 9 AM–5 PM ET
- © 2026 Answers in Genesis