
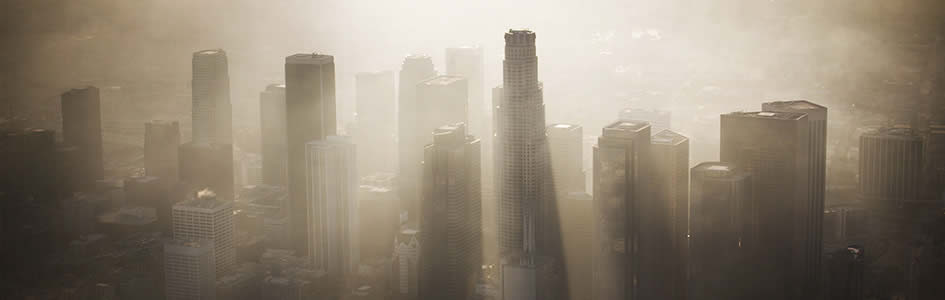
Climate Crisis or Media Hype? Investigating the Reality of Earth's Climate
Cherry-Picked Climate Data
In this day and age, it is hard not to be inundated with panic-driven news about climate change. The media often paints a bleak picture of the existential crisis humans are supposedly facing regarding earth’s climate. News anchors often use talking points such as the “climate crisis,” “climate catastrophe,” and “climate emergency,” while also reporting on the scientific consensus that the earth is on the brink of a climactic disaster. Many political leaders and celebrities also advocate for the gloom-and-doom outlook suggesting humans are causing irreversible destruction to the earth.
At the 2014 United Nations Climate Summit, actor Leonardo DiCaprio made a speech on the “climate crisis” while claiming scientists were in agreement about increased environmental threats such as extreme weather events. He stated during his speech, “The time to answer humankind’s greatest challenge is now. We beg of you to face it with courage and honesty.”
When the scientific community appears to agree on climactic events, it would seem wise to take action. But there also appears to be a “catch-22” within the scientific community surrounding climate science. Because, if you go against the climate narrative that is popularly portrayed in the media or according to the media-claimed scientific consensus, you are often labeled as a climate “skeptic” or climate “denier.” Any video on YouTube with the word climate change will result in a context flag from the United Nations declaring what they believe climate change is.
Is the scientific consensus that the media so often points to about climate science legitimate?
Is the scientific consensus that the media so often points to about climate science legitimate? Are political leaders, celebrities, and climate activists facing the “threat” of the “climate crisis” with courage and honesty? Let’s examine a few popular claims about the supposed climate crisis and look at what the science shows regarding these claims.
Claim 1. The Earth Is Experiencing Unprecedented Warming.
This past summer, a slew of articles were written that claimed the earth was experiencing recording-breaking temperatures.1, 2, 3 The United Nations Secretary-General Antonio Guterres also warned, “The era of global warming has ended, the era of global boiling has arrived.”4
Measuring the earth’s global temperature is not an easy thing for scientists to do.
Did the earth really break record temperatures? Perhaps but perhaps not. Measuring the earth’s global temperature is not an easy thing for scientists to do. Scientists have only been continuously monitoring the earth’s temperature since the late 1800s. Proxy data and geologic evidence suggest the earth has experienced previous warm periods in its historic past.5 But there is a lot of information scientists do not know about temperature prior to the late 1800s. Therefore, making a claim that the earth’s temperature has reached its hottest on record since it began is not scientifically accurate.
Many of the articles depicting the record-breaking temperatures earth had set—some of which were from government agencies—would also have the general public believe there is a harmful warming trend resulting from human-caused climate change.
In NASA’s article titled, “NASA Clocks July 2023 as Hottest Month on Record Ever Since 1880,” Gavin Schmidt, a NASA climate scientist and director of the Goddard Institute of Space Studies (GISS) Temperature dataset, stated, “The science is clear this isn’t normal. Alarming warming around the world is driven primarily by human-caused greenhouse gas emissions. And that rise in average temperatures is fueling dangerous extreme heat that people are experiencing here at home and worldwide.”6
In a different article, NASA presents a graph with temperature anomalies from 1880 to 2023.7 Using land- and sea-based thermometers and proxies, NASA calculates temperature anomalies that show how far temperature has departed from a base average. Temperature can also be calculated using an absolute or measured value. It should be noted that most temperature datasets whether measured using anomalies or absolute values do have biases.8,9,10 But a careful examination of the NASA data does not support the claim that there is catastrophic warming.
At first glance, NASA’s anomaly graph appears to show a foreboding warming trend after the 1960s.11 The choice of color used on the graph to show the warming trend is also in red—which appears to be a common thread when these graphs are made to aesthetically emphasize an ominous warming trend.
The NASA GISS dataset is a publicly available dataset.12 Recreating their temperature anomaly graph does show what appears to be a warming trend from 1880 to 2023 (Figure 1).
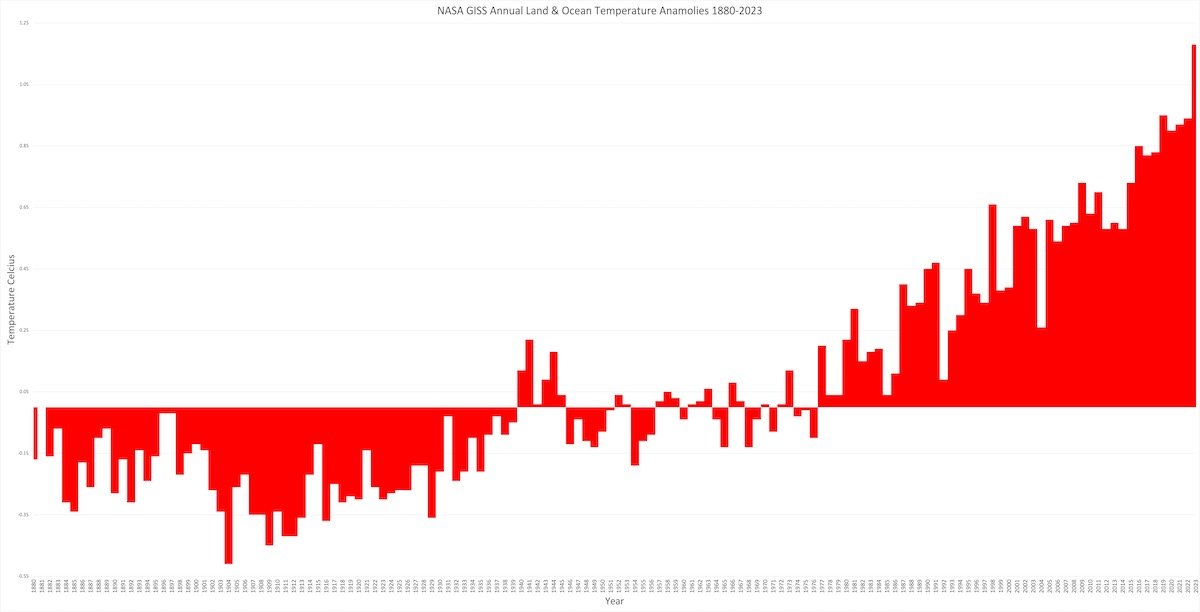
Figure 1. NASA GISSTEMP Annual Land and Ocean Temperature Anomalies for July from 1880–2023 in degrees Celsius. Data downloaded from NASA Goddard Institute for Space Studies: https://data.giss.nasa.gov/gistemp/. Graph created in Excel.
However, when absolute values using the same GISS dataset are plotted, the warming trend is gradual as meteorologist Anthony Watts points out in his article, “New WUWT Global Temperature Feature: Anomaly vs. Real-World Temperature.”13 Watts is labeled as one of the “climate deniers” because he frequently speaks against the panic-driven climate alarmism that is popularly portrayed in the media.
If you plot the same anomaly values as absolute temperature values within a temperature range (-20° to 120°F) that humans might experience at different parts of the globe as Watts did,14 the temperature trend is gradual (Figure 2). The absolute temperature values for July from 1880 to 2023 range from a minimum value of 56.2°F in 1904 to a maximum value of 59.3°F in 2023. In the 143 years that temperature has been continuously monitored, the difference in minimum and maximum temperature is only 3.1°F.
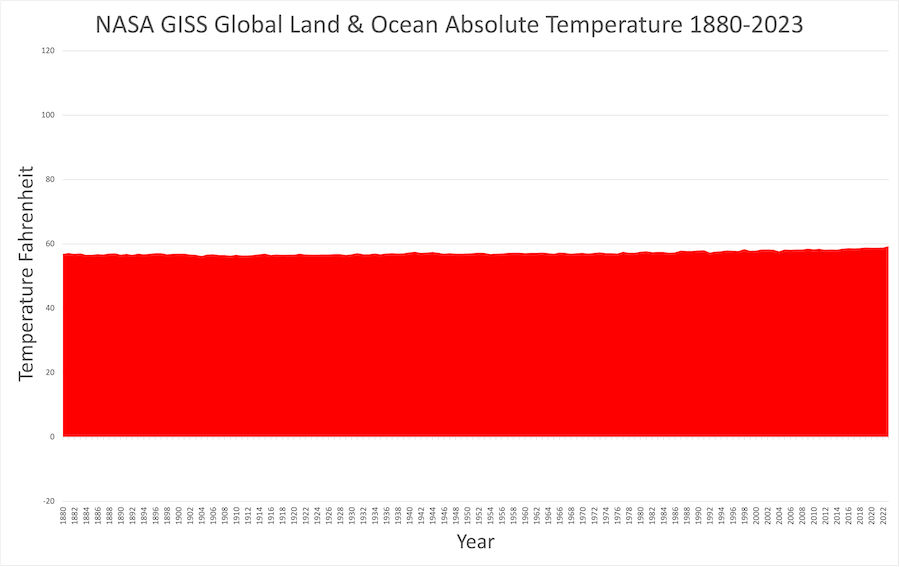
Figure 2. NASA GISSTEMP data as absolute Fahrenheit values for July from 1880–2023. Graph originally created by Anthony Watts15 and recreated by downloading data from NASA Goddard Institute for Space Studies: https://data.giss.nasa.gov/gistemp/. Graph created in Excel.
This is certainly not worth panicking over especially when temperature values often fluctuate more than 3 degrees throughout a single day. Consider a person who works in an area that experiences each weather season (e.g., fall, winter, spring, summer). Before this person drives to work in the winter, they will likely need to scrape frost off their windshield in the morning but will drive home with a frost-free windshield in the afternoon because of the increase in temperature during the day.
Yet this panic-induced narrative that humans are supposedly causing increased warming continues to dominate the media.
Yet this panic-induced narrative that humans are supposedly causing increased warming continues to dominate the media. And if you’re a scientist who uses science to point out the claim that humans are to blame for increased warming is unwarranted, you are also given the title “skeptic” or “denier.”
Take for example, Dr. Roy Spencer, a former NASA employee and current principal scientist with the University of Alabama Huntsville (UAH), as well as Dr. John Christy, a distinguished professor of atmospheric science and director of the Earth System Science Center also with UAH. Spencer and Christy developed a global satellite temperature dataset beginning in 1979. Their dataset measures anomalies from advanced microwave sounding units on NOAA and NASA satellites to accurately measure global temperature readings.16 Spencer and Christy are actively involved in sound research that does not support the sensationalist claims that humans are causing a climate catastrophe.17 They often report on the many naturally occurring climate processes that contribute to why a region might experience increased warming. Even though these distinguished scientists have contributed a great deal to the world of climate science, they too have been occasionally labeled as “climate deniers.”
Spencer and Christy’s satellite data indicates the earth has only warmed +0.15°C per decade since satellite records began in 1979.18 In other words, a catastrophic warming is not occurring. The warming that occurred this past summer was due in part to the Earth experiencing an El Niño occurrence. El Niños are naturally occurring climactic events in the Pacific Ocean that bring warmer and drier conditions to various parts of the globe.19
By their own admittance, NASA mentions the current El Niño event did in fact contribute to the warmth that was observed in the summer due to high sea surface temperatures.20 But it appears that natural, climactic events that indeed contribute to fluctuations in temperature records are brushed aside for the sensationalist claim that humans are to blame.
Claim 2. The Earth Is Experiencing Increased Weather Events.
Another panic-driven reason that humans are allegedly causing destruction to the planet is the apparent increase in extreme weather events. Two of the most common weather occurrences that seem to be blamed by humans are wildfires and hurricanes.
The Environmental Protection Agency (EPA) has a climate change indicators website used to inform the general public of the increase in catastrophic weather events driven by man-made climate change. On the website’s home page, the EPA states, “Temperatures are rising, snow and rainfall patterns are shifting, and more extreme climate events—like heavy rainstorms and record high temperatures—are becoming more common. Many of these observed climate changes are linked to rising levels of greenhouse gases in our atmosphere, caused by human activities.”21
While the EPA does not list wildfires specifically on their home page, they have an entire page devoted to wildfires as a climate change indicator in the United States.22 At first glance of this page, visitors are met with a graph showing wildfire frequency in the United States from 1983 to 2021. They also list a series of “Key Points” under the graph. The second key point says, “The extent of area burned by wildfires each year appears to have increased since the 1980s. According to National Interagency Fire Center data, of the 10 years with the largest acreage burned, all have occurred since 2004, including the peak year in 2015 (see Figure 2).”
When examining the referenced Figure 2 from this key point, a blue line showing data from the National Interagency Fire Center (NIFC) displays an increase in millions of acres of area burned since the 1980s (Figure 3). This data leads the public to believe there has been a steady rise in the number of wildfires since the 1980s.
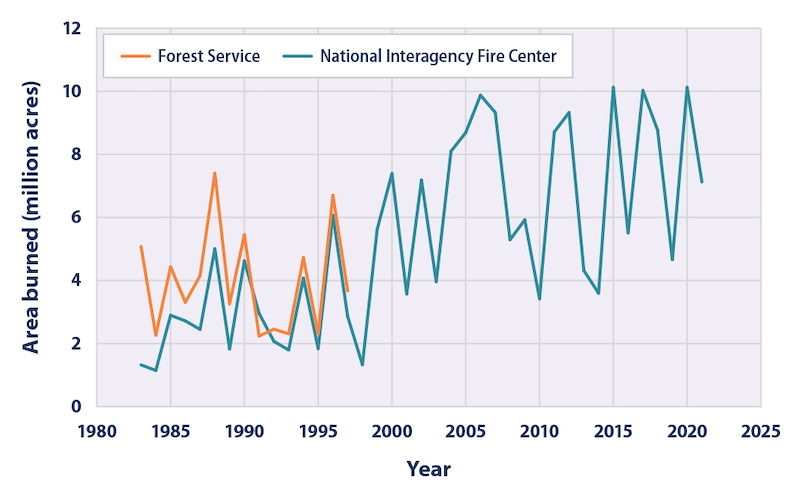
Figure 3. EPA’s Figure 2 from the Climate Change Indicators Wildfire website: https://www.epa.gov/climate-indicators/climate-change-indicators-wildfires.
Additionally, if people go to the referenced NIFC database to find the data, they will see similar dates on the statistics of wildfires in the United States. Note that the NIFC changed their reporting process, and in March 2021, they removed data prior to 1983 on their website. However, their historical policy documents still have historical records regarding previous wildfire frequency. According to the policy reports, it appears there was a substantially higher number of wildfires in the 1920s.23 Additionally, a series of graphs have been made from the NIFC historical records prior to the removal of the data (Figure 4).24,25
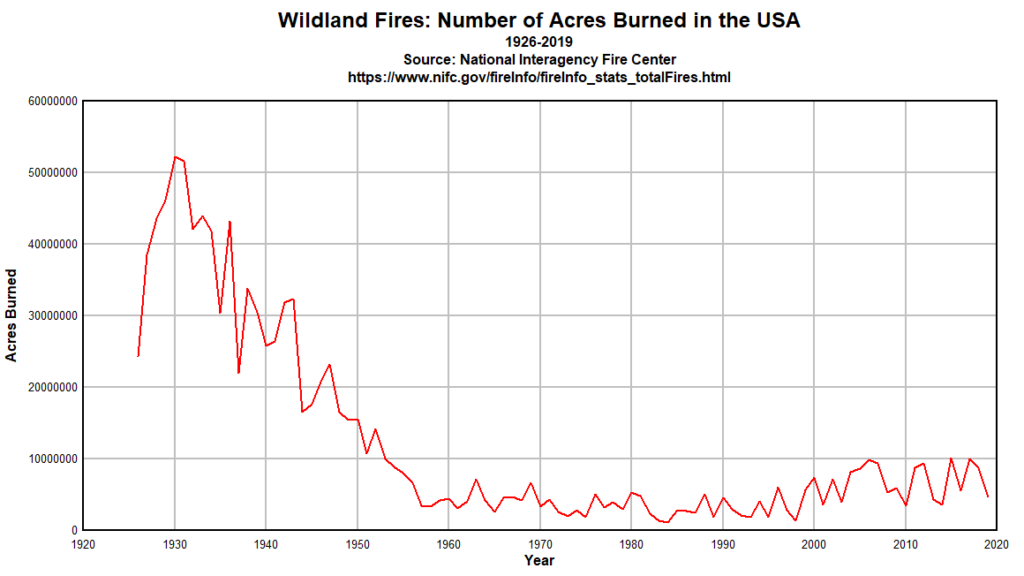
Figure 4. Number of Acres Burned in the USA from 1926–2019. This data was created by Anthony Watts from the National Interagency Fire Center dataset historical data prior to the removal of the data in March of 2021: https://climateataglance.com/climate-at-a-glance-u-s-wildfires/.
When comparing the NIFC historical records with the data the NIFC and the EPA currently have on their websites, it would seem as if both agencies are purposely not showing the historical records. Why would the data start in 1983? Well, when the data only reflects 1983 to present day, it does appear there has been an increase in the frequency of wildfires. Are these government agencies fanning the flame of the narrative that there is an increase in wildfires when it appears to contradict the historical records?
While wildfires can be destructive, there are also many ecological benefits when fire is introduced to a landscape.26 Hurricanes, on the other hand, do not bring the same ecological benefits to a landscape. They are often devastating, causing widespread destruction when they make landfall. Many residents in Florida felt the damaging effects of Hurricane Ian in 2022.
Despite media claims, hurricanes are not becoming more frequent in the United States.
However, despite media claims, hurricanes are not becoming more frequent in the United States. In an article titled, “How Climate Change Is Rapidly Fueling Super Hurricanes,” the Washington Post reported that, “Since 2017, an unprecedented number of storms rated Category 4 or stronger have lashed the U.S. shoreline.”27 The National Oceanic and Atmospheric Administration (NOAA) has a hurricane center database that is publicly accessible.28 Their data for the number of US hurricane strikes by decade shows there has actually been a decrease in the number of all category hurricanes types (1–5) (Figure 5). There is no obvious upward trend in the number of US hurricanes since 1851.
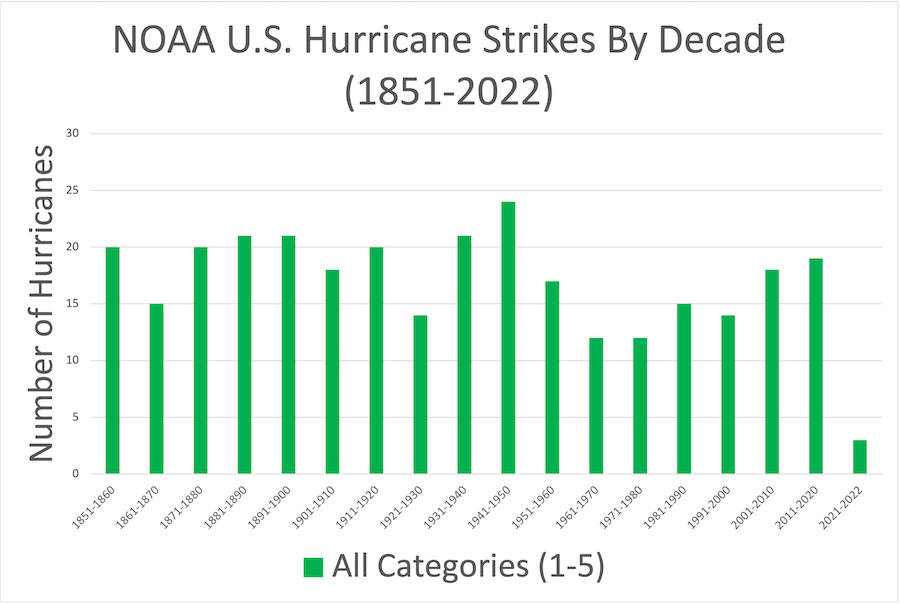
Figure 5. NOAA U.S. Hurricane Strikes by Decade for all category 1–5 hurricane types. Data accessed from https://www.nhc.noaa.gov/pastdec.shtml. Graph created in Excel.
Additionally, the data indicates major hurricane categories (3–5) have been decreasing not increasing (Figure 6).
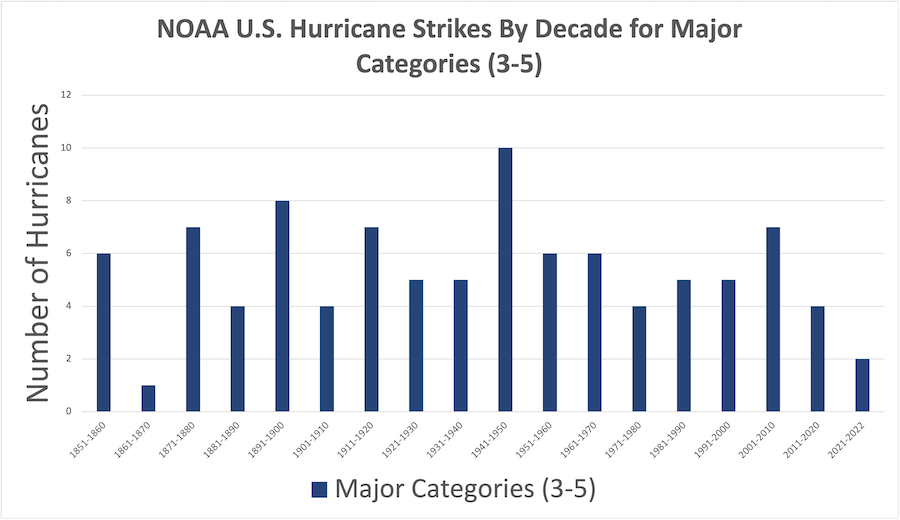
Figure 6. NOAA U.S. Hurricane Strikes by Decade for major category 3–5 hurricane types. Data accessed from https://www.nhc.noaa.gov/pastdec.shtml. Graph created in Excel.
The media reports that hurricanes are becoming more frequent as well as intensifying in their category type are unfounded when you examine the data.
Claim 3. Arctic Sea Ice Is Receding.
Images of melting arctic sea ice and dying polar bears have also been used by the media to garner empathetic responses to perpetuate the narrative of man-made climate change.
Images of melting arctic sea ice and dying polar bears have also been used by the media to garner empathetic responses to perpetuate the narrative of man-made climate change.
Former Vice President and Climate Activist Al Gore once claimed there was a “75% chance that the entire north polar ice cap, during the summer months, could be completely ice-free within the next five to seven years.” Mr. Gore made this statement during a 2009 speech at the Copenhagen Climate Conference predicting arctic sea ice might be gone by 2014 through 2016.
Additionally, NASA’s Global Climate Change Vital Signs website has a page devoted to arctic sea ice minimum extent. Their key takeaway from this page claims arctic sea ice is shrinking by 12.2% per decade due to warmer temperatures (Figure 7).29
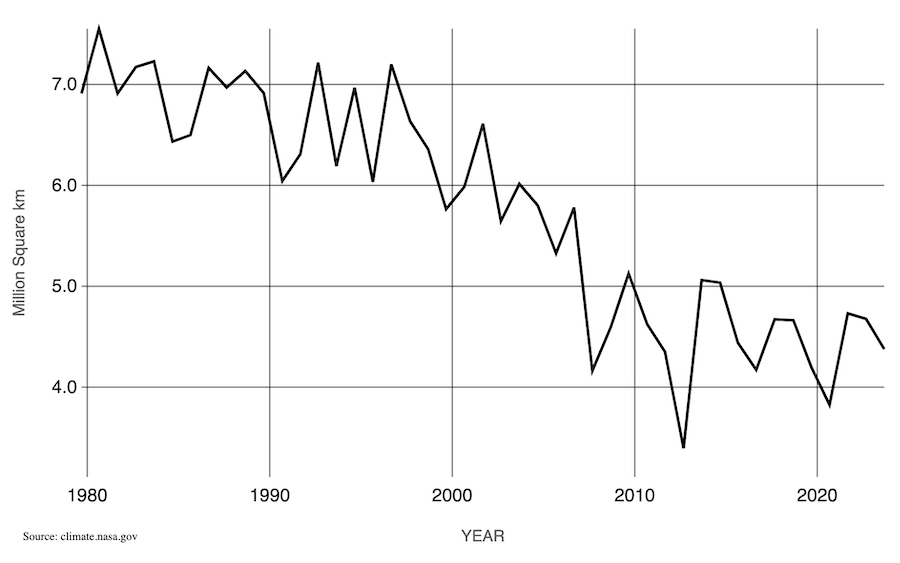
Figure 7. NASA Arctic Sea Ice Annual September Minimum Extent from 1979–2023: https://climate.nasa.gov/vital-signs/arctic-sea-ice/.
The graph shows a drastic decline from 1980 to around 2007 when the September sea ice minimum extent begins to level off. However, examining the data from the most recent decade (2012–2022) shows the September minimum extent is actually increasing. September sea ice in 2012 hit its lowest extent in the satellite records with a value of 3.39 million square kilometers. But the value in 2022 is 4.37 million square kilometers. That’s a decadal increase! Even though their website claims there is a 12.2 % decrease per decade, the most recent decade shows an increase.
Additionally, the National Snow and Ice Data Center as well as the National Institute of Polar Research shows arctic sea ice was greater in the summer of 2023 than the previous 10-year average (Figure 8).30, 31
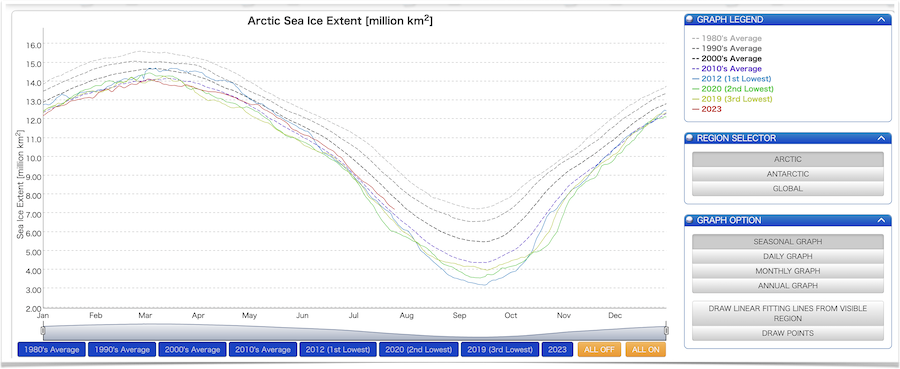
Figure 8. National Institute of Polar Research, “Arctic Sea Ice Extent” in million km2 indicating the summer of 2023 (in red) had a greater amount of sea ice than the previous 10-year average. https://ads.nipr.ac.jp/vishop/#/extent.
Unfortunately, climate science has become increasingly polarized. The “scientific consensus” the media describes is often from the cherry-picked climate data presented by headlines as well as government agencies that appear to sensationalize climate data. This tactic is causing people to be gripped by fear that humans are causing irreversible damage to the earth. Of course, climates do change, but people do not need to panic when climate alarmism is presented by the media indicating it is an existential crisis caused by humans.32
The climate alarmism narrative is a religious one that is rooted in worship of the creature rather than the Creator. The media’s panic-driven claims of man-made climate change is antithetical to God’s Word. A biblical worldview of climate change and environmental issues gives people confidence to stand on the authority of God’s Word, knowing that he is both author and sustainer of his creation (Genesis 1:1; Psalm 24:1). God’s Word demonstrates that he has designed many cyclic, climatic processes (Genesis 8:22).
With God’s Word as the foundation, people can boldly proclaim that God is in complete control of his creation.
The Bible also makes it clear that people should not be enticed by creaturely worship (Romans 1:25). Presenting cherry-picked data to grip people by fear so they believe people are causing destruction to the earth is an example of creaturely worship. This is because it often causes people to elevate the planet over people. But God has commanded people to exercise wise dominion over his creation. People should care for God’s creation in a way that brings him honor and glory while also avoiding worship of creature.33
It is also unfortunate that scientists who do not agree with the climate alarmism narrative are labeled as climate “skeptics” or “deniers.” Science and Scripture are not in conflict. Science can help provide valuable information regarding the state of the earth’s climate, but it should also be noted that science is not supreme. God and his Word is the foundation by which people must examine any scientific claim. With God’s Word as the foundation, people can boldly proclaim that God is in complete control of his creation.


Footnotes
- NASA, “NASA Announces Summer 2023 Hottest on Record,” September 14, 2023, https://www.nasa.gov/news-release/nasa-announces-summer-2023-hottest-on-record/.
- Zach Levitt and Elena Shao, “Where This Summer Was Relentlessly Hot,” The New York Times, October 8, 2023, https://www.nytimes.com/interactive/2023/10/09/world/hottest-summer-global-map.html.
- Laura Paddison, “The World Has Just Experienced the Hottest Summer on Record – By a Significant Margin,” CNN, September 6, 2023, https://www.cnn.com/2023/09/06/world/hottest-summer-record-climate-intl/index.html.
- United Nations, “Hottest July Ever Signals ‘Era of Global Boiling Has Arrived’ Says UN Chief,” UN News, July 27, 2023, https://news.un.org/en/story/2023/07/1139162.
- Michael J. Oard, “How Much Global Warming Is Natural?” Environmental Science, Answers in Genesis, April 16, 2008, https://answersingenesis.org/environmental-science/climate-change/how-much-global-warming-is-natural/.
- NASA, “NASA Clocks July 2023 as Hottest Month on Record Ever Since 1880,” News, Global Climate Change, August 14, 2023, https://climate.nasa.gov/news/3279/nasa-clocks-july-2023-as-hottest-month-on-record-ever-since-1880.
- NASA, “Summer 2023 Hottest on Record.”
- Roy Spencer, “Gavin’s Plotting Trick: Hide the Incline,” Global Warming, February 1, 2024, https://www.drroyspencer.com/2024/02/gavins-plotting-trick-hide-the-incline/.
- National Centers for Environmental Information, “Anomalies vs. Temperature,” Climate Monitoring, accessed February 26, 2024, https://www.ncei.noaa.gov/access/monitoring/dyk/anomalies-vs-temperature.
- Gavin, “Absolute Temperatures and Relative Anomalies,” Climate Modelling, Climate Science, December 23, 2014, https://www.realclimate.org/index.php/archives/2014/12/absolute-temperatures-and-relative-anomalies/.
- NASA, “Summer 2023 Hottest on Record.”
- GISTEMP Team, GISS Surface Temperature Analysis (GISTEMP), version 4, NASA Goddard Institute for Space Studies, accessed February 26, 2024, https://data.giss.nasa.gov/gistemp/.
- Anthony Watts, “New WUWT Global Temperature Feature: Anomaly vs. Real-World Temperature,” Watts Up with That, March 12, 2023, https://wattsupwiththat.com/2023/03/12/new-wuwt-global-temperature-feature-anomaly-vs-real-world-temperature/.
- Watts, “New WUWT Global Temperature.”
- Watts, “New WUWT Global Temperature.”
- University of Alabama in Huntsville, “ESSC Global Temperature Report,” ESSC Global Temperature Report, accessed February 26, 2024, https://www.uah.edu/essc/weather-products/global-temperature-report.
- Roy W. Spencer and John R. Christy, “Effective Climate Sensitivity Distributions from a 1D Model of Global Ocean and Land Temperature Trends, 1970–2021,” Theoretical and Applied Climatology 155 (2023): 299–308, https://link.springer.com/content/pdf/10.1007/s00704-023-04634-7.pdf.
- University of Alabama in Huntsville, “ESSC Global Temperature Report.”
- NOAA, “What Are El Niño and La Niña?” Facts, National Ocean Service, last updated August 24, 2023, https://oceanservice.noaa.gov/facts/ninonina.html.
- NASA, “Summer 2023 Hottest on Record.”
- United States Environmental Protection Agency, “Climate Change Indicators in the United States,” accessed February 26, 2024, https://www.epa.gov/climate-indicators.
- United States Environmental Protection Agency, “Climate Change Indicators: Wildfires,” last updated February 2, 2024, https://www.epa.gov/climate-indicators/climate-change-indicators-wildfires.
- National Interagency Fire Center, “Background and Scope,” in Review and Update of the 1995 Federal Wildland Fire Management Policy, accessed February 26, 2024, https://web.archive.org/web/20070810191055/http://www.nifc.gov/fire_policy/docs/chp1.pdf.
- E. Calvin Beisner, “Misleading Infographic About Climate Change and Wildfires,” Cornwall Alliance, August 17, 2022, https://cornwallalliance.org/2022/08/misleading-infographic-about-climate-change-and-wildfires/.
- Climate at a Glance, “U.S. Wildfires,” Climate Change Impacts, accessed February 26, 2024, https://climateataglance.com/climate-at-a-glance-u-s-wildfires/.
- Gordon Wilson, “Wildfires: Cause for Alarm?” Environmental Science, Answers in Genesis, April 1, 2021, https://answersingenesis.org/environmental-science/wildfires-cause-alarm/.
- Scott Dance and Kasha Patel, “How Climate Change Is Rapidly Fueling Super Hurricanes,” Climate, Washington Post, September 29, 2022, https://www.washingtonpost.com/climate-environment/2022/09/29/ian-hurricane-rapid-intensification-climate/.
- National Hurricane Center, “U.S. Hurricane Strikes by Decade,” accessed February 26, 2024, https://www.nhc.noaa.gov/pastdec.shtml.
- NASA, “Arctic Sea Ice Minimum Extent,” Vital Signs, accessed February 26, 2024, https://climate.nasa.gov/vital-signs/arctic-sea-ice/.
- National Snow and Ice Data Center, “Charctic Interactive Sea Ice Graph,” Arctic Sea Ice News & Analysis, accessed February 26, 2024, https://nsidc.org/arcticseaicenews/charctic-interactive-sea-ice-graph/.
- National Institute of Polar Research, “Arctic Sea Ice Extent,” February 26, 2024, https://ads.nipr.ac.jp/vishop/#/extent.
- Jessica Deford and Avery Foley, “Climate Alarmism,” Environmental Science, Answers in Genesis, January 24, 2023, https://answersingenesis.org/environmental-science/climate-alarmism/.
- Gordon Wilson, “Caring Past Our Prejudice” Environmental Science, Answers in Genesis, September 13, 2020, https://answersingenesis.org/animals/caring-past-our-prejudice/.

Support the creation/gospel message by donating or getting involved!

Answers in Genesis is an apologetics ministry, dedicated to helping Christians defend their faith and proclaim the good news of Jesus Christ.
- Customer Service 800.778.3390
- © 2024 Answers in Genesis