
Helium Diffusion Rates Support Accelerated Nuclear Decay
by
Dr. Russell Humphreys, Dr. Andrew A. Snelling, Dr. John Baumgardner,
and
Dr. Steve Austin
on
February 2, 2011
; last featured
May 4, 2016
Featured in
Answers in Depth
Keywords: helium, diffusion, radioisotopes, age, dating, nuclear decay, zircon, biotite, accelerated decay
This paper was originally published in the Proceedings of the Fifth International Conference on Creationism, pp. 175–195 (2003) and is reproduced here with the permission of the Creation Science Fellowship of Pittsburgh .
Introduction
A significant fraction of the earth’s radioactive elements, particularly uranium and thorium, appear to be in the granitic rock of the upper continental crust. Uranium and thorium tend to be localized in the granites inside special minerals such as zircon (zirconium silicate, ZrSiO4). Zircon has high hardness, high density, and high melting point, often forming microscopic, stubby, prismatic crystals with dipyramidal terminations (fig. 1) commonly grayish, yellowish, or reddish brown. Atoms of uranium and thorium within cooling magma replace up to 4% of the normal zirconium atoms within the lattice structure of zircon as it is crystallizing. The radioactive zircon crystals often become embedded in larger crystals, such as mica, as magma cools and solidifies.
As the uranium and thorium nuclei in a zircon decay, they produce helium. For example, uranium-238 (238U) emits eight alpha particles as it decays through various intermediate elements to lead-206 (206Pb). Each alpha particle is a helium-4 nucleus (4He), consisting of two protons and two neutrons. Each explosively expelled 4He nucleus eventually comes to a stop, either within the zircon or in the surrounding material. There it quickly gathers two electrons and becomes a neutral helium atom.
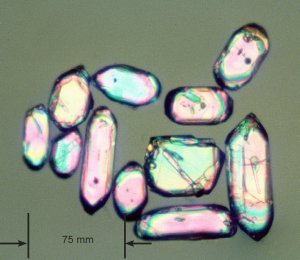
Fig. 1. Zircons from the Jemez Granodiorite. Photo by R. V. Gentry.
Helium is a lightweight, fast-moving atom that does not form chemical bonds with other atoms. It can diffuse through solids relatively fast, meaning that helium atoms wiggle through the spaces between atoms in a crystal lattice and spread themselves out as far from one another as possible. For the same reason it can leak rapidly through tiny holes and cracks, making it ideal for leak detection in laboratory vacuum systems. The diffusion and leakage rates are so great that believers in the billions of years had expected most of the helium produced during the alleged 4.5 billion years of the earth’s existence to have worked its way out of the crust and into the earth’s atmosphere long ago.
But the helium is not in the earth’s atmosphere! When non-specialists hear that, they usually assume that (A) helium has risen to the top of the atmosphere as it would in a balloon, and (B) most of the helium has then leaked from the top of the atmosphere into space. However, assumption (A) is wrong, because unconfined helium spreads throughout the atmosphere from top to bottom, like any other gas.
On assumption (B), the simple kinetic theory of gases says the loss of neutral helium atoms into space would be much too small to account for the missing helium. In 1957 Melvin Cook, a creationist chemist, pointed out this problem in the prestigious journal Nature.1 In 1990 Larry Vardiman, a creationist atmospheric scientist, calculated that even after accounting for such slow leakage into space, the earth’s atmosphere has only about 0.04% of the helium it should have if the earth were billions of years old.2
Until the 1970s, uniformitarians (see next section) had no good answer. However in recent decades they have been trying to evolve one. Satellite data3,4 show that ions (electrically charged atoms) of helium (and other gases) move back and forth along the earth’s magnetic lines of force above much of the atmosphere. Some space plasma physicists theorize that storms of particles from the sun blow the helium ions loose from the lines of force outward into space frequently enough “to balance the [assumed] outgassing from the earth’s crust.”5 The theory is very complex, and no creationist expert in the field has yet reviewed it to see whether it is well founded.
Rapid helium leaks into space are essential to uniformitarians, but slow leaks are not essential to creationists. If the leakage turns out to be slow, it would bolster our case here. But fast leakage would not damage our case. The next section offers evidence for a much simpler explanation of the missing atmospheric helium: most of the radiogenic (nuclear decay generated) helium has not entered the earth’s atmosphere. It is still in the earth’s crust and mantle—much of it still in the zircons. In this paper we argue that the helium has not had enough time (less than 14,000 years) to escape the zircons, much less the crust.
The Helium is Still in the Zircons
In the 1970s, geoscientists from Los Alamos National Laboratory began drilling core samples at Fenton Hill, a potential geothermal energy site just west of the volcanic Valles Caldera in the Jemez Mountains near Los Alamos, New Mexico (fig. 2). There, in borehole GT-2, they sampled the granitic Precambrian basement rock, which we will refer to as the Jemez Granodiorite. It has a radioisotopic age of about 1.5 billion years, as measured by various methods using the uranium, thorium, and lead isotopes in the zircons themselves.6 The depths of the samples varied from near the surface down to 4.3 kilometers, with temperatures from 20°C to 313°C. The Los Alamos team sent some of these core samples to Oak Ridge National Laboratory for isotopic analysis.
Most of the zircons were in biotite,7 a black mica common in granitic rock. At Oak Ridge, Robert Gentry, a creationist physicist, crushed the samples (without breaking the much harder zircon grains), extracted a high-density residue (because zircons have a density of 4.7 grams/cm3), and isolated the zircons by microscopic examination, choosing crystals about 50–75 µm long. The zircon masses were typically on the order of micrograms. The Oak Ridge team then heated the zircons to 1000°C in a mass spectrometer and measured the amount of helium 4 liberated. In 1982 they published the data in Geophysical Research Letters.8 Table 1 details their results.
The first column itemizes the samples analyzed. The second and third columns show the depth and temperature of each sample in situ. The fourth column shows the volume (at standard temperature and pressure) of helium liberated in the lab per microgram of zircon.
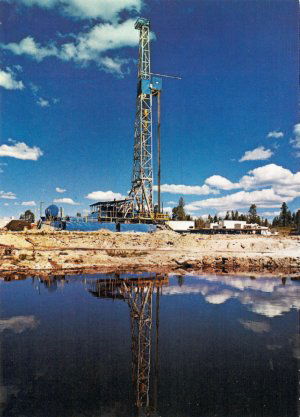
Fig. 2. Drilling rig at Fenton Hill, New Mexico. Photo by Los Alamos National Laboratory.
The fifth column is the ratio of the observed quantity of helium Q (total number of helium atoms in the crystal) to the calculated quantity Q0 that the zircons would have accumulated and retained if there had been no diffusion. The Los Alamos team measured the amount of radiogenic lead in zircons 2.9 km deep in the same borehole and same granodiorite,9 and the Oak Ridge team confirmed those figures with their ion microprobe.10 Because the various decay chains generate an average of 7.7 helium atoms per lead atom produced, Gentry and his colleagues were able to calculate Q0 from the amount of lead in the zircons. In doing so, they compensated for the estimated loss of alpha particles emitted from near the edges of the zircons out into the surrounding material.
The Oak Ridge team estimated that uncertainties in calculating Q0 might limit the accuracy of the ratio Q/Q0 to ±30%. The sixth column of the table shows the resulting estimated errors in the ratios.
Samples 1 through 6 came from the granodiorite, but sample zero came from larger zircons in a surface outcrop of an entirely different rock unit. For that rock unit U/Th/Pb information was not available, making an estimate of Q0 not feasible. Lacking a ratio, we cannot use sample zero in the calculations.
Samples 5 and 6 had the same amount of helium. Gentry and his colleagues noted that helium emerged from those samples in shorter bursts than the other samples, indicating a different distribution of helium within those zircons. In section 6, we will show that the amount of helium from sample 5 is just about what would be expected from the trend in the cooler samples. But we allow for the possibility of its error being considerably larger than the cooler samples.
According to the thermal behavior outlined in the next section, we would ordinarily expect that the hotter sample 6 would have much less helium than sample 5. The fact that the helium content did not decrease suggests that some additional effect may have occurred which limited the outflow of helium from the zircon. In section 6 we suggest a likely explanation.
The above considerations suggest that we can use samples 1 through 5 in a theoretical analysis with ordinary diffusion. We will treat sample 6 as a special case.
Samples 1 through 3 had helium retentions of 58, 27, and 17%. The fact that these percentages are high confirms that a large amount of nuclear decay did indeed occur in the zircons. Other evidence strongly supports much nuclear decay having occurred in the past.11 We emphasize this point because many creationists have assumed that “old” radioisotopic ages are merely an artifact of analysis, not really indicating the occurrence of large amounts of nuclear decay. But according to the measured amount of lead physically present in the zircons, approximately 1.5 billion years worth—at today’s rates—of nuclear decay occurred. Supporting that, sample 1 still retains 58% of all the alpha particles (the helium) that would have been emitted during this decay of uranium and thorium to lead.
| Depth (m) | Temperature (°C) | He (10–9 cm3/µg) | Q/Q0 | Error | |
|---|---|---|---|---|---|
| 0 | 0 | 20 | 82 | — | — |
| 1 | 960 | 105 | 86 | 0.58 | ±0.17 |
| 2 | 2170 | 151 | 36 | 0.27 | ±0.08 |
| 3 | 2900 | 197 | 28 | 0.17 | ±0.05 |
| 4 | 3502 | 239 | 0.76 | 0.012 | ±0.004 |
| 5 | 3930 | 277 | ~0.2 | ~0.001 | — |
| 6 | 4310 | 313 | ~0.2 | ~0.001 | — |
It is the uniformitarian assumption of invariant decay rates, of course, that leads to the usual conclusion that this much decay required 1.5 billion years. Uniformitarianism is the prevalent belief of this age that “all things continue as they were from the beginning” (2 Peter 3:4), denying the possibility of any physical interventions by God into the natural realm. Uniformitarians interpret scientific data to support their idea of cosmic and biological evolution during billions of years of imagined time. We maintain that their interpretations are a distortion of observational data all around us. As the Bible predicted (2 Peter 3:5–6), uniformitarians willingly ignore “elephant in the living room” evidence for a recent creation and a worldwide catastrophic flood. In this paper we will include their assumption of billions of years of time and solely natural processes in the uniformitarian model we construct for diffusion.
Getting back to the helium data, notice that the retention levels decrease as the temperatures increase. That is consistent with ordinary diffusion: a high concentration of helium in the zircons diffusing outward into a much lower concentration in the surrounding minerals, and diffusing faster in hotter rock. As the next section shows, diffusion rates increase strongly with temperature.
In later sections, we will show that these large retentions are quite consistent with diffusion taking place over thousands of years, not billions of years.
How Diffusion Works
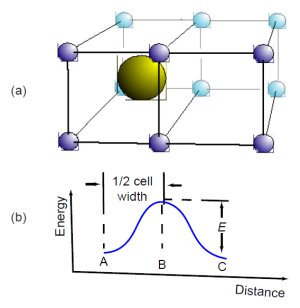
Fig. 3. Helium atom moving through crystal.
If the reader is not very familiar with diffusion and wants to know more, we recommend a very clear little book, Atomic Migration in Crystals, written for nonexperts.12 Fig. 3, adapted from that book,13 illustrates how an atom diffuses through a solid crystal lattice of other atoms. Fig. 3(a) shows a helium atom initially at position A, surrounded by a cell of lattice atoms. The lattice atoms repel the helium atom, tending to confine it to the center of the cell, where the repulsion balances out in all directions. Heat keeps the atoms of the lattice vibrating at its various resonant frequencies.The vibrating atoms continually bump into the helium atom, jostling it from all sides. The higher the temperature, the more vigorous the jostling.
Every now and then, the lattice atoms will bump the helium atom hard enough to push it into the “activated” position B, midway between cells. The lattice atoms must give the helium enough kinetic energy to overcome the repulsive potential energy barrier between the cells, which we have shown in Fig. 3(b). This required amount of kinetic energy, E, is called the activation energy. If the lattice atoms have given any more energy than E to the helium atom, it will not stop at position B. Instead, it will continue on to position C at the center of the adjacent cell. The helium atom has thus moved from one cell to the next.
If there is an initially high concentration of helium atoms in one part of the crystal, these random motions will eventually spread—that is, diffuse—the helium more uniformly though the crystal and out of it. Let us define C(x, y, z, t) as the concentration, the number of helium atoms per unit volume, at position (x, y, z) at time t. Many textbooks show that when diffusion occurs, the time rate of change of C is proportional to the “sharpness” of the edges of the distribution of helium, or more mathematically, proportional to the Laplacian of C, ∇2C:

Equation 1a
where
Equation 1b
Equation (1a), called the “diffusion equation,” occurs frequently in many branches of physics, for example to describe heat conduction in solids. Specialists in the diffusion of atoms through materials call it “Fick’s Second Law of Diffusion.” The factor D, the diffusion coefficient (or “diffusivity”), has dimensions of cm2 (or m2) per second. (Most of the diffusion literature still uses centimeters and calories instead of meters and joules). Very often it turns out that at high temperatures, the diffusion coefficient depends exponentially on the absolute temperature T (degrees kelvin above absolute zero):
Equation 2
where R is the universal gas constant, 1.986 calories per mole-kelvin (8.314 joules per mole-kelvin). The constant D0 is independent of temperature. The “intrinsic” activation energy E0 typically is between 10 and 100 kilocalories per mole (about 40 and 400 kilojoules per mole). Section 10 discusses how these quantities are related to the geoscience concept of closure temperature, and it shows why the concept is irrelevant to our conclusions.
If the crystal has defects such as vacancies in the crystal lattice, impurities, dislocations, or grain boundaries, then the diffusion coefficient equation will have a second term related to the defects:
Equation 3
The defect parameters (D1 and E1) are almost always smaller than the intrinsic parameters (D0 and E0):
Equation 4
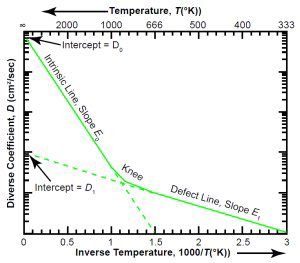
Fig. 4(a). Typical Arrhenius plot.
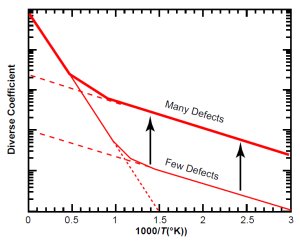
Fig. 4(b). Increasing defects slides the defect line upward.
The typical Arrhenius plot in Fig. 4(a) shows how the diffusion coefficient D of equation (3) depends on the inverse of the absolute temperature, 1/T. Because the plot uses a logarithmic scale for D and a linear scale for 1/T, each term of equation (3) manifests itself as a straight line in the temperature region where it is dominant. (Plotting with T instead of 1/T would make the lines curved instead of straight.) The slopes are proportional to the activation energies E0 and E1. The intercepts with the vertical axis, where 1/T is zero, are the parameters D0 and D1.
The intrinsic line has a steep slope and a high intercept, while the defect line has a shallow slope and a low intercept. Starting on the right-hand side of the graph, at low temperatures, let us increase the temperature, moving to the left. When the temperature is high enough, we reach a region, the “knee,” where the two terms of equation (3) are about equal. To the left of that region, at high temperatures, the intrinsic properties of the crystal dominate the diffusion. To the right of the knee, at lower temperatures, the defects dominate. Because defects are very common in natural crystals, this two-slope character is typical.14
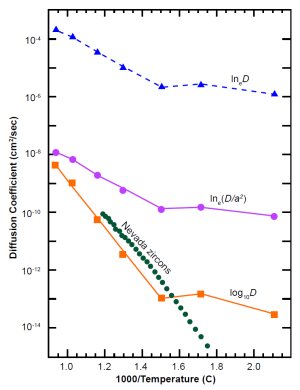
Fig. 5. Interpretations of russian zircon data (blue, pink and orange symbols and lines) compared with Nevada zircon data (green). The ordinate is D (not D/a2).
For a given type of mineral, the location of the knee can vary greatly. It depends on the value of D1, which depends on the amount of defects in the particular crystal. The more defects there are, the higher D1 is. If we increase the number of defects, the defect line moves upward (keeping its slope constant) on the graph, as Fig. 4(b) illustrates.
In the case of zircons containing radioisotopes, the main cause of defects is radiation damage, so highly radioactive (“metamict”) zircons will have a large value of D1, causing the defect line to be higher on the graph than for a low-radioactivity zircon.
Early Zircon Data Were Ambiguous
In 1970 Sh. A. Magomedov, a researcher in Dagestan (then part of the Soviet Union) published diffusion data for radiogenic lead and helium in highly metamict (radiation-damaged) zircons from the Ural Mountains.15 These were the only helium-in-zircon diffusion data we could find during an extensive literature search we did in 1999.
Magomedov was mainly interested in lead diffusion, so he did not list his helium data explicitly in a table. Instead he showed them in a small graph, along with data for lead diffusion and electrical conductivity, σ. His label for the ordinate was ambiguous: “ln(D, σ).” In scientific literature “ln” with no further note usually means the natural logarithm (base e). The common logarithm (base 10) is usually shown as “log.” If we assume Magomedov was reporting lneD, the resulting diffusion coefficients would be very high, as the triangles and dotted line near the top of Fig. 5 show. The RATE book shows that interpretation.16 Another interpretation is that Magomedov was reporting lne(D/ a2), where a is the effective radius of his zircons, about 75 µm. As Fig. 5 shows (circles and thin solid line near middle), that still gives rather high diffusion rates in the temperature range of interest to us.
Based on those supposed high rates, we assumed in our first theoretical model17 that the zircons were a negligible impediment to helium outflow, compared to the minerals around them. But in 2001 we received a preprint of a paper18 listing new helium diffusion data in zircons from several sites in Nevada. Fig. 5 shows some of that data (Fish Canyon Tuff sample FCT-1) as a line of solid dots. These data were many orders of magnitude lower than our interpretation of Magomedov’s graph. The Russian data would agree with the Nevada data if we re-interpret Magomedov’s label as meaning “log10D,” the common logarithm of D. Fig. 5 shows that interpretation near the bottom (squares and thick solid line). The small difference between the high-slope “intrinsic” parts of the Russian and Nevada data is easily attributable to site-to-site differences in composition. The nearly horizontal part of the Russian data is probably a “defect” line due to much radiation damage (see end of previous section).
The new data and our new interpretation of the old data imply that zircon is not a negligible impediment to helium diffusion. In this paper we have changed our theoretical model to account for that fact. As we will show in later sections, our new interpretation of the Russian data is still five orders of magnitude too high for uniformitarian models. But it is quite compatible with creationist models and time scales.
Data for Minerals from the Jemez Granodiorite
Measurements of noble gas diffusion in a given type of naturally occurring mineral often show significant differences from site to site, caused by variations in composition. For that reason it is important to get helium diffusion data on zircon and biotite from the same rock unit (the Jemez Granodiorite) which was the source of Gentry’s samples. Accordingly, in 2000 the RATE project commissioned such experimental studies.
Los Alamos National Laboratory was kind enough to give us core samples of granodiorite from the same borehole, GT-2, and from a similar depth, about 750 meters. The geology laboratory at the Institute for Creation Research extracted the biotite using heavy liquids and magnetic separation. Using similar methods, Activation Laboratories, Ltd., in Ontario, Canada, extracted the zircons and chose three of them for isotopic analysis. Appendix A gives those results, which agreed fairly well with the lead-lead dates published by Los Alamos National Laboratory for the same site.19 We reserved the rest of the zircons, about 0.35 milligrams, for diffusion measurements.
Through a small mining company, Zodiac Minerals and Manufacturing, we contracted with Kenneth A. Farley of the California Institute of Technology (Division of Geological and Planetary Sciences) to measure the diffusion coefficients of the zircon and biotite from the Jemez site. He is a recognized expert on helium diffusion measurements in minerals, having many publications related to that field. As we wished, Zodiac did not tell Farley they were under contract to us, the goals of the project, or the sites of the samples. We have encouraged him to publish his measurements and offered to send him the geologic site information if he does so. Appendices B and C list his data in detail.
Figs. 6(a) and 6(b) are Arrhenius plots of the most relevant data for zircon and biotite, respectively. The zircon data are from the Jemez Granodiorite in New Mexico, the Fish Canyon Tuff in Nevada, and the Ural Mountains in Russia (the re-interpreted Magomedov data). The first two studies are for essentially the same size crystals (average length ~60 µm, a ≅ 30 µm, section 6). The Russian study was for crystals ~150 µm long. The biotite data are from the Jemez Granodiorite. Those, and similar data we obtained (see Appendix B) for biotite from the Beartooth Gneiss in Wyoming, are the only data for that mineral we know of. For comparison to the biotite data, we have also included published data for muscovite, a different mica.20
Notice that all the sets of zircon data agree fairly well with each other at high temperatures. At 390ºC (abscissa = 1.5), the Russian data have a knee, breaking off to the right into a more horizontal slope for lower temperatures. That implies a high number of defects (see section 4), consistent with the high radiation damage Magomedov reported. The Nevada and New Mexico data go down to 300ºC (abscissa = 1.745) with no strong knee, implying that the data are on the intrinsic part of the curve. A least-squares fit of equation (2) to the New Mexico (Jemez Granodiorite) zircon data gives the following diffusion parameters:
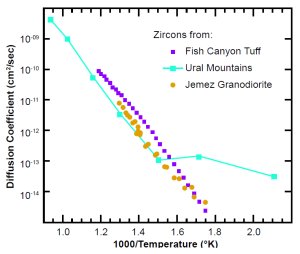
Fig. 6(a). Observed diffusion coefficients in zircons. The ordinate is D (not D/a2).
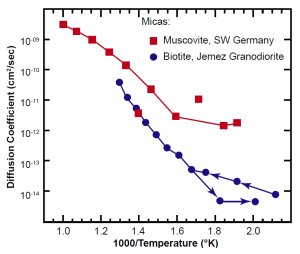
Fig. 6(b). Observed diffusion coefficients in two types of mica. The ordinate is D (not D/a2).
Equation 5a
However, there appears to be a slight decrease of slope in the data below 450ºC. Later on we will need a fit at temperatures below that. The best-fit parameters from 440ºC down to 300ºC are:
Equation 5b
Because the New Mexico zircons are radioactive, they must have some defects and should have a knee at some lower temperature than 300ºC. We have recently requested that Farley get additional data from 100ºC to 300ºC. But as of February 2003, we do not have reliable data for that range.
The muscovite and biotite data are consistent with each other. In the low temperature range of interest, the New Mexico biotite has a somewhat higher diffusion coefficient than the zircons. That means the biotite, while not being negligible, did not impede the helium outflow as much as the zircon did.
A New Creation Model
We need a theoretical framework in which we can interpret the diffusion data of the previous section. As we mentioned at the end of section 4, in our first creation model we wrongly assumed that the zircons were a negligible impediment to the helium diffusion. In this section we construct a new creation model.
As before, the creation model starts with a brief burst of accelerated nuclear decay generating a high concentration C0 of helium uniformly throughout the zircon (like the distribution of U and Th atoms), but not in the surrounding biotite. After that the helium diffuses out of the zircon into the biotite for a time t. As in our previous model, we chose t = 6,000 years. The time is short enough that the additional amount of helium generated by normal nuclear decay would be small compared to the initial amount. We assume the temperatures to have been constant at today’s values. We will show in section 7 that this assumption is generous to uniformitarians.
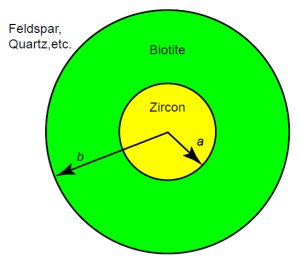
Figure 7. Spherical approximation of the zircon-in-biotite system.
Because the biotite diffusion coefficients are not too different from the zircon coefficients, we should have a model accounting for two materials. Diffusion in zircon is isotropic, with helium flowing essentially at the same rate in all three directions. Diffusion in biotite is not isotropic, because most of the helium flows two-dimensionally along the cleavage planes of the mica. But accounting for anisotropy in the biotite would be quite difficult, so we leave that refinement to the next generation of analysts. To keep the mathematics tractable, we will assume spherical symmetry, with a sphere of zircon of effective radius a inside a spherical shell of material having an outer radius b, as Fig. 7 shows. Then the concentration C will depend only on time and the distance r from the center.
Let us consider the values we should assign to a and b. Magomedov’s zircons were between 100 and 200 µm long,21 for an average length of about 150 µm. He assigned the crystals an effective radius of half the average length, or 75 µm. Gentry selected zircons between about 50 µm and 75 µm, for an average that we will round off to 60 µm. Half of that gives us an effective radius for our analysis of the Jemez zircons:

Equation 6
Biotite in the Jemez Granodiorite is in the form of flakes averaging about 0.2 mm in thickness and about 2 mm in diameter. Because the cleavage planes are in the long direction, and diffusion is mainly along the planes, the diameter is the relevant dimension for diffusion. That gives us an outer radius of:

Equation 7
Because b is more than 32 times larger than a, the disk-like (not spherical) volume of biotite the helium enters is more than 1,000 (~32 squared) times the volume of the zircon. This consideration affects the boundary conditions we choose for r = b, and how we might interpret sample 6 (see section 2), as follows.
Suppose that helium could not escape the biotite at all. Then as diffusion proceeds, C would decrease in the zircon and increase in the biotite, until the concentration was the same throughout the two materials. After that C would remain essentially constant, at about 0.001 C0. The fraction Q/Q0 remaining in the zircon would be about 0.001, which is just what Gentry observed in sample 6.
So a possible explanation for sample 6 is that diffusion into the surrounding materials (feldspar, quartz), and leakage (along grain boundaries) was slow enough (during the relatively short time t) to make the outflow of helium from the biotite negligible. For that sample, the temperature and diffusion coefficient were high enough for helium to spread uniformly through both zircon and biotite during that time.
Our measurements (see Appendix B) showed that the helium concentration in the Jemez biotite at a depth of 750 m was small, only about 0.32 × 10⁻⁹ cm3 (at STP) per microgram. Taking into account the difference in density of biotite and zircon (3.2 g/cm3 and 4.7 g/cm3), that corresponds to almost exactly the same amount of helium per unit volume as sample 6 contained. That suggests the zircon and biotite were near equilibrium in sample 6, thus supporting our hypothesis.
At lower temperatures, for helium retentions greater than 0.001, C in the biotite would be lower than C in the zircon. In that case the boundary at r = b would not significantly affect the outflow of helium from the zircon. We will assume this was approximately true for sample 5 also, but not for sample 6. To simplify our analysis for samples 1 through 5, we will assume the usual boundary condition, that the concentration C(r) falls to zero at radius r = b:

Equation 8
For the initial conditions, we assume that the concentration is a constant, C0, inside the zircon, and zero outside it:
At
Equation 9a
and
Equation 9b
After time zero, there also must be continuity of both C and helium flow at r = a. We need a solution to the diffusion equation (1), in its radial form, for the above boundary conditions. In 1945, R. P. Bell published such a solution for the corresponding problem in heat flow.22 His solution, which is mathematically complex, allows for different diffusion coefficients in the two regions. We will simplify the solution considerably by making the diffusion coefficients the same in both regions. Because the diffusion coefficient of biotite is somewhat higher than that of zircon at the temperatures of interest, our solution will have slightly slower (no more than 30% slower) helium outflows and correspondingly longer times than the real situation. But because uniformitarians need to increase the time anyhow, they should not object to this approximation.
With the above simplification, Bell’s equation reduces to one given by Carslaw and Jaeger.23 After making the simple changes required to go from heat flow to atomic diffusion,24 and accounting for notation differences (note meanings of a and b), we get the following solution:
Equation 10
where D is the diffusion coefficient of zircon. Next we need to determine the fraction Q/Q0 of helium retained in the zircon after diffusion takes place for time t. First, note that Q(t) and Q0 are the volume integrals of C(r, t) and C0 in the zircon:
Equation 11a

Equation 11b
Volume integrating equation (10) as required by equation (11a) and dividing by equation (11b) gives the fraction of helium retained in the zircon after time t elapses:
Equation 12
where we define the function Sn as follows:
Equation 13
To solve equation (12), let us rewrite it in terms of a new variable, x, and a new function F(x) as follows:

Equation 14
where
Equation 14b
and

Equation 14c
Now we can use software like Mathematica25 to find the roots of equation (14a), that is, to find the values of x for which F(x) will give us particular values of the retention fraction Q/Q0. When the latter and b/a are large, the series in equation (14b) does not converge rapidly. For our value of b/a, 33.3, it was necessary to go out to N = 300 to get good accuracy. Table 2 lists the resulting values of x, and the values of D necessary to get those values from equation (14c) using a time of 6,000 years, t = 1.892 × 10¹¹ seconds. The estimated errors in D result from the reported errors in Q/Q0.
In summary, the fifth column shows the zircon diffusion coefficients that would be necessary for the Jemez zircons to retain the observed fractions of helium (third column) for 6,000 years at the temperatures listed in the second column.
| T (ºC) | Q/Q0 | x | D (cm2/sec) | Error (%) | ||
|---|---|---|---|---|---|---|
| 1 | 105 | 0.58±0.17 | 5.9973 × 10⁻⁴ | 3.2103 × 10⁻¹⁸ | +122 | –67 |
| 2 | 151 | 0.27±0.08 | 2.4612 × 10⁻³ | 1.3175 × 10⁻¹⁷ | +49 | –30 |
| 3 | 197 | 0.17±0.05 | 4.0982 × 10⁻³ | 2.1937 × 10⁻¹⁷ | +39 | –24 |
| 4 | 239 | 0.012±0.004 | 3.3250 × 10⁻² | 1.7798 × 10⁻¹⁶ | +33 | –18 |
| 5 | 277 | ~0.001 | 1.8190 × 10⁻¹ | 9.7368 × 10⁻¹⁶ | — | — |
This new model turns out to be amazingly close to our previous creation model—within 0.5% for sample 1 and 0.05% for the others—despite the different assumptions and equations. This strongly suggests there is an underlying (but not obvious) physical equivalence between the two models, and that the small differences are merely due to the numerical error of the calculations. Thus our previously published predictions26 of diffusion coefficients are valid, but they should be re-interpreted to apply to zircon, not biotite.
We will compare the data not only to this new model, but also to a uniformitarian model, which we describe in the next section.
Uniformitarian Model
In the RATE book,27 we outlined a simple model appropriate for the uniformitarian view, with its billions of years, of the history of the rock unit:
. . . steady low-rate radioactive decay, He production, and He diffusion for 1.5 billion years at today’s temperatures in the formation.
Our assumption of constant temperatures is generous to uniformitarians. Two geoscientists from Los Alamos National Laboratory constructed a theoretical model of the thermal history of the particular borehole (GT-2) we are concerned with.28 They started by assuming “a background vertical geothermal gradient of 25ºC/km.” That means initial conditions with absolute temperatures 16% to 31% lower than today for samples 1 through 6, putting them in the low-slope “defect” range of diffusion. Their model then has an episode of Pliocene-Pleistocene volcanism starting to increase the temperature several megayears ago. It would peak about 0.6 Myr ago at temperatures roughly 50 to 120ºC above today’s values, depending on depth. After the peak, temperatures would decline steadily until 0.1 Myr ago, and then level off at today’s values.
Later studies29,30 add a more recent pulse of heat and have past temperatures being higher, 110ºC to 190ºC more than today’s levels just 24,000 years ago, and higher before that.31 This would put the samples well into the high-slope “intrinsic” range of diffusion.
The effect of such heat pulses would be great. For several million years, the diffusion coefficients would have been about two to three orders of magnitude higher than today’s values. During the previous 1.5 billion years, supposedly at lower temperatures than today, the diffusion rates would have been on the “defect” line (fig. 4a) and therefore not much below today’s levels. Thus the long time at lower temperatures would not compensate for high losses during the few million years at higher temperatures. This makes our assumption of constant temperatures at today’s values quite favorable to the uniformitarian scenario.
As we will see, the long uniformitarian time scale requires zircon diffusion coefficients to be about a million times slower than the measured biotite coefficients. That means the biotite would not be a significant hindrance to the helium flow in the uniformitarian model, and the results would not be much different than those for a bare zircon. For continuous production of helium, the concentration C in the zircon would reach its steady-state level relatively quickly (see section 10) and remain at that level for most of the alleged 1.5 billion years. Again we assume a spherical zircon of radius a. Carslaw and Jaeger32 give the corresponding solution for heat flow. Converting to the notation for atomic diffusion shows us how the steady-state concentration C in the zircon depends on the radius r from the center:
Equation 15
| T (ºC) | Q/Q0 | D (cm2/sec) | Error (%) | |
|---|---|---|---|---|
| 1 | 105 | 0.58±0.17 | 2.1871 × 10⁻²³ | ±30 |
| 2 | 151 | 0.27±0.08 | 4.6981 × 10⁻²³ | ±30 |
| 3 | 197 | 0.17±0.05 | 7.4618 × 10⁻²³ | ±30 |
| 4 | 239 | 0.012±0.004 | 1.0571 × 10⁻²¹ | ±30 |
| 5 | 277 | ~0.001 | 1.2685 × 10⁻²⁰ | — |
Here Q0 is the total amount of helium that would be produced in time t. That is, Q0/t is the helium production rate. As before, D is the diffusion coefficient of zircon, and a is the effective radius. Using equation (11a) to integrate equation (15) and dividing by Q0 gives us the fraction of helium Q/Q0 in the zircon in the steady-state condition:

Equation 16
Table 3 gives us the zircon diffusion coefficients required to give the observed retentions for a = 30 µm and t = 1.5 billion years = 4.73 × 10¹⁶ seconds.
The same reasoning on sample 6 applies for this model as for the creation model, except that it is less likely the helium could remain totally sealed in the biotite for over a billion years. For the other samples, this model is exactly the same as our previously published “evolution” model.33
Comparing Data and Models
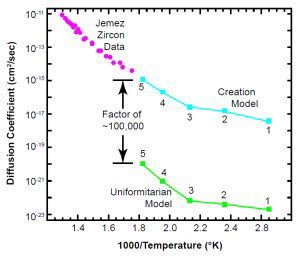
Fig. 8. The zircon data line up very well with the creation model. The ordinate is D (not D/a2).
Fig. 8 shows the zircon data from the Jemez Granodiorite, along with the two models. The zircon data are fully consistent with the creation model. These new data are also quite consistent with all published zircon data, as Fig. 6(a) shows. As of this writing (February, 2003) we do not have reliable data on the Jemez zircons below 300ºC. But notice that the data have the same slope as the Creation model points for samples 3, 4, and 5, and the data nearly touch point 5. That allows us to use equation (14c) to roughly estimate values for the time t for those three points:

Equation 17
Using a/b = 0.03, the values of D/a2 extrapolated down from the best-fit experimental parameters of Equation 5b, and the values of x and errors from Table 2 gives us the following times for diffusion to have occurred:
The errors above do not include the statistical errors in extrapolating the fit to the zircon diffusion coefficient data down to the lower temperatures required. Actual data for temperatures below 300ºC would eliminate the extrapolation error.
| x | D/b2 (sec–1) | Time t (years) | Error (years) | ||
|---|---|---|---|---|---|
| 3 | 4.0982 × 10⁻³ | 1.2672 × 10⁻¹⁵ | 10389 | +4050 | –2490 |
| 4 | 3.3250 × 10⁻² | 1.6738 × 10⁻¹⁴ | 6392 | +2110 | –1150 |
| 5 | 1.8190 × 10⁻¹ | 1.2311 × 10⁻¹³ | 4747 | — | — |
In the meantime we can say the data of Table 4, considering the estimates of error, indicate an age between 4,000 and 14,000 years. This is far short of the 1.5 billion year uniformitarian age!
It looks as if the retention data require points 1 and 2 of the creation model to be on a “defect” line, similar to the Russian data for radiation-damaged zircons. The similarity gives us good reason to hope that the low-temperature zircon data, when they come in, will come close to those model points as well.
| Sample | T (°C) | Observed D/a2 (sec–1) Extrapolated from data | Helium retentions Q/Q0 | |
|---|---|---|---|---|
| After 1.5 billion years | Observed | |||
| 3 | 197 | 1.4080 × 10⁻¹² | 1.0007 × 10⁻⁶ | 0.170 |
| 4 | 239 | 1.8597 × 10⁻¹¹ | 7.5764 × 10⁻⁸ | 0.012 |
| 5 | 277 | 1.3679 × 10⁻¹⁰ | 1.0368 × 10⁻⁸ | 0.001 |
The data offer no hope for the uniformitarian model. It is unlikely that the zircon data will continue down on the intrinsic line for five more orders of magnitude. It is certain (because all natural zircons have defects) that at some lower temperature there will be a knee, where the data will break off horizontally to the right into a shallow-slope defect line. But even if that were not to be the case, the intrinsic line would pass well above the uniformitarian model.
We can also use these observed data to estimate what helium retentions Gentry should have found if the zircons were really 1.5 billion years old. If no helium could leak out of the biotite during that time, then all of the samples would have had retentions of about 0.001, much less than samples 1 through 4 [see section 6 between equations (7) and (8)]. However, we know that helium can diffuse through the surrounding materials, quartz and feldspar. By assuming those are negligible hindrances, we can use the extrapolated data in equation (16) to get lower bounds on the retentions. Table 5 shows the results:
In summary, the observed diffusion rates are so high that if the zircons had existed for 1.5 billion years at the observed temperatures, samples 1 through 5 would have retained much less helium than we observe. That strongly implies they have not existed nearly so long a time.
Closing Some Loopholes
One response to these data from uniformitarians might be this: assert that temperatures in the Jemez Granodiorite before the Pliocene-Pleistocene volcanism were low enough to make the diffusion coefficients small enough to retain the helium. We discussed that possibility in section 7, but here we point out how low such temperatures are likely to be.
Until we have reliable low-temperature data for the Jemez Granodiorite zircons, we must reason indirectly from the other data we have. The only published low-temperature zircon data, the Russian data by Magomedov,34 show a defect line (fig. 6a). The line is rather high, probably because those zircons had many defects due to the high radiation damage Magomedov reported. But the slope of the defect line is similar to the slope of points 1, 2, and 3 in both the creation and uniformitarian models of the retention data (fig. 8). Since the high-temperature Jemez zircon data agree well with the creation model, there is good reason to suppose the low-temperature data will also conform to that model. In that case, the parameters of the zircon defect line would be:

Equation 18
Because E1 is small, the slope of the defect line is small. These numbers would mean that to get the diffusion coefficients low enough to meet uniformitarian needs, say on the order of 10–23 cm2/sec, the pre-Pliocene temperature in the granodiorite would have to have been about –190°C, near that of liquid nitrogen. No uniformitarian we know would advocate an earth that was cryogenic for billions of years! Of course these values are only preliminary estimates, and perhaps the actual defect line of the Jemez zircons would require less severe cooling. But it demonstrates how zircons would need unrealistically low temperatures to retain large amounts of helium for uniformitarian eons of time.
A second uniformitarian line of defense might be to claim that the helium 4 concentration in the biotite or surrounding rock is presently about the same as it is in the zircons. (Such a scenario would be very unusual, because the major source of 4He is U or Th series radioactivity in zircons or a few other minerals like titanite or apatite, but not biotite.) The scenario would mean that essentially no diffusion into or out of the zircons is taking place. However, our measurements (Appendix B) show that except for possibly samples 5 and 6, the concentration of helium in the biotite [section 6, between equations (7) and (8)] is much lower than in the zircons. Diffusion always flows from greater to lesser concentrations. Thus helium must be diffusing out of the zircons and into the surrounding biotite. Moreover, the Los Alamos geothermal project made no reports of large amounts of helium (commercially valuable) emerging from the boreholes, thus indicating that there is not much free helium in the formation as a whole.
A third uniformitarian defense could be that the Oak Ridge team somehow made a huge mistake, that the actual amounts of helium were really many orders of magnitude smaller than they reported. But as Appendix C reports, our experimenter Kenneth Farley, not knowing how much he should find and going up to only 500°C, got a partial (not exhaustive) yield of 540 nanomoles of helium per gram of zircon, or in Gentry’s units, 11 × 10–9 cm3/ µg. That is on the same order of magnitude as Gentry’s results in Table 2, which reports the total (exhaustive) amount liberated after heating to 1000°C until no more helium would emerge. Thus our experiments support Gentry’s data.
“Closure Temperature” Doesn’t Help Uniformitarians
Some uniformitarians try to use the geoscience concept of closure temperature to claim that zircons below that temperature are permanently closed systems, losing no significant helium by diffusion. They fail to understand that even well below that temperature, zircons can re-open and lose large amounts of helium. Here we explain closure temperature and re-opening, and show that in the uniformitarian scenario, the Jemez Granodiorite zircons would re-open early in their history.
Consider a hot zircon cooling down in newly formed granite. If the cooling rate is constant, then the seminal article by Martin Dodson35 on closure temperature shows that the diffusion coefficient D (of helium moving out of the zircon) decreases exponentially with a time constant τ given by:
Equation 19
where T is the absolute temperature, dT/dt is the cooling rate, R is the gas constant, and E0 is the activation energy in the “intrinsic” region (section 3).
In the uniformitarian scenario, nuclear decay produces helium at a nearly constant rate. At the beginning, when the zircon is very hot, helium diffuses out of the crystal as fast as nuclear decay produces it. But as the zircon cools, it will eventually reach a temperature below which the loss rate becomes less than the production rate. That point is essentially what Dodson meant by the “closure” temperature. He showed that for a constant cooling rate the closure temperature Tc is
Equation 20
where A is a dimensionless constant (55 for a sphere), D0 is the “intrinsic” intercept in Fig. 4(a), a is the effective radius of the crystal, and τ is the diffusion time constant given by equation (19). Since τ depends on the cooling rate, hence affecting Tc somewhat, geoscientists imply some conventional cooling rate when they specify a closure temperature. In Appendix C Kenneth Farley assumes a cooling rate of 10ºC per million years and finds that the closure temperature of the Jemez Granodiorite zircons is 128ºC.
That temperature is below the borehole temperatures of samples 2 through 5 (Table 1). Most of our samples were above the closure temperature, so they would always have been open systems, losing helium. However, even if they had reached closure temperature, the analysis below shows they would not have remained closed for long.
After the zircon cools below the closure temperature, helium begins to accumulate in it, as Fig. 9 shows. Later, as the temperature levels off to that of the surrounding rock, the diffusion coefficient D becomes constant. (The case of changing long-term temperatures is harder to analyze, but there will still be a time of re-opening.) As the amount of helium in the zircon increases, Fick’s laws of diffusion (section 3) say the loss rate also increases. Eventually, even well below the closure temperature, the loss rate approaches the production rate, an event we call the “re-opening” of the zircon. Then the amount of helium in the zircon will level off at a steady-state value, which we called Q in equation (16). After that, the zircon will again lose helium as fast as nuclear decay produces it.
Let us estimate the closure interval, the length of time tci the zircon remains closed before re-opening. As we remarked just below Equation 15, the helium production rate is Q0/t, where t is the uniformitarian age of the zircon, 1.5 billion years. Assuming a linear rise as a first approximation, the production rate multiplied by tci is roughly equal to the steady-state value of Q, which is the right-hand side of our equation (16) multiplied by Q0:
Equation 21
Solving for tci gives us the approximate closure interval:

Equation 22
If the closure interval were long compared to the age of the zircon, then the zircon would indeed be a closed system. But would that be the case in the uniformitarian view of the Jemez zircons? Using the effective radius of the zircons, 30 µm, and the measured values of D (fig. 8) in equation (22) gives us tci values between a few dozen years and a few thousand years, depending on the temperature of the sample in the borehole. Those times are very small compared to the uniformitarian age of 1.5 billion years.
So even if the zircons had cooled rapidly and reached closure temperature early in their history, our measured diffusion rates say they would have re-opened shortly after that. During most of the alleged eons the zircons would have been an open system. They would be losing as much helium as the nuclear decay produced. Thus closure temperature does not help uniformitarians in this case, because the closure interval is brief.
Conclusion
The experiments the RATE project commissioned in 2000 have clearly confirmed the numerical predictions of our creation model (updated slightly in section 6), which we published beforehand.36 Other experimental data published since 2000 agree with our data. The data also clearly reject the uniformitarian model. The data and our analysis show that over a billion years worth of nuclear decay have occurred very recently, between 4,000 and 14,000 years ago. This strongly supports our hypothesis of recent episodes of highly accelerated nuclear decay.
These diffusion data are not precise enough to reveal details about the acceleration episodes. Were there one, two, or three? Were they during early Creation Week, after the Fall, or during the Flood? Were there only 500 to 600 million years worth of acceleration during the year of the Flood, with the rest of the acceleration occurring before that? We cannot say from this analysis. However, the fact that these zircons are from a Precambrian rock unit sheds some light on various creationist models about when strata below the Cambrian formed. We can say that the “diffusion clock” requires a large amount of nuclear decay to have taken place within thousands of years ago, after the zircons became solid. At whatever time in biblical history Precambrian rocks came into existence, these data suggest that “1.5 billion years” worth of nuclear decay took place after the rocks solidified not long ago.
Our most important result is this: Helium diffusion casts doubt on uniformitarian long-age interpretations of nuclear data and strongly supports the young world of Scripture.
Acknowledgments
Many people and institutions have contributed to collecting and interpreting these data. In particular, we would like to thank Robert Gentry, Bill Hoesch, Yakov Kapusta, Roger Lenard, Majdah al-Quhtani, and Phil Legate. We would also like to thank supporters of the RATE project for their generous contributions and prayers.
Appendix A: Isotopic Analysis of Jemez Zircons
Here we summarize a report by Dr. Yakov Kapusta (Activation Laboratories, Ltd., in Ontario, Canada) on an isotopic analysis he made on three zircons from Los Alamos National Laboratories core sample GT-2480 from borehole GT-2 in the Jemez Granodiorite at a depth of 750 m.
Dr. Kapusta separated zircons from the core sample using heavy liquids and magnetic separation. He picked three crystals from the concentrate for analysis. Table A1 shows his results and notes.
Mass fractionation correction of 0.15%/amu±0.04%/amu (atomic mass unit) was applied to single-collector Daly analyses and 0.12%/amu ± 0.04% for dynamic Faraday-Daly analyses. Total procedural blank less than 0.6 pg for Pb and less than 0.1 pg for U. Blank isotopic composition: 206Pb/204Pb = 19.10 ± 0.1, 207Pb/204Pb = 15.71 ± 0.1, 208Pb/204Pb = 38.65 ± 0.1. Age calculations are based on the decay constants of Steiger and Jäger.37 Common-Pb corrections were calculated by using the model of Stacey and Kramers38 and the interpreted age of the sample. The upper intercept of the concordia plot of the 206Pb/238U and 207Pb/238U data was 1439.3 Ma ± 1.8 Ma. (The published Los Alamos radioisotope date for zircons from a different depth, 2900 m, was 1500 ± 20 Ma39)
Appendix B: Diffusion Rates in Biotite
Below are two reports by Kenneth Farley (with our comments in brackets) on his measurements of helium diffusion in biotite from two locations. As far as we know, these are the only helium-in-biotite diffusion data that have been reported. The first sample, BT-1B, was from the Beartooth Gneiss near Yellowstone National Park. The second sample, GT-2, was from the Jemez Granodiorite, borehole GT-2, from a depth of 750 m. The geology laboratory at the Institute for Creation Research extracted the biotite for from both rock samples by crushing, magnetic separation, and density separation with heavy liquids. Farley sieved both samples to get flakes between 75 and 100 microns in diameter. Taking half of the average diameter to get an effective radius of 44 microns, we plotted the resulting diffusion coefficients for the GT-2 sample in Fig. 6(b). We plotted the muscovite data in Fig. 6(b) using the effective radius recommended in the report,40 130 microns.
| # | Mass (µg) (a) | Concentrations | Ratios | |||||
|---|---|---|---|---|---|---|---|---|
| U (ppm) | Pb (ppm) | Pb(c) (pg) (b) | 206Pb / 204Pb (c) | 208Pb / 206Pb (d) | 206Pb / 238U (e) | Error (2σ%) | ||
| z1 | 0.8 | 612 | 106.1 | 13.6 | 241.2 | 0.633 | 0.102828 | .50 |
| z2 | 1.0 | 218 | 59.6 | 1.4 | 2365.1 | 0.253 | 0.236433 | .23 |
| z3 | 1.7 | 324 | 62.7 | 1.7 | 3503.6 | 0.218 | 0.172059 | .11 |
| # | Ratios | Ages | ||||||
|---|---|---|---|---|---|---|---|---|
| 207Pb / 235U (e) | Error (2σ%) | 207Pb / 206Pb (e) | Error (2σ%) | 206Pb / 238U | 207Pb / 235U | 207Pb / 206Pb | Correlation coefficent | |
| z1 | 1.2744 | .56 | 0.08989 | .23 | 631.0 | 834.4 | 1423.2 | 0.912 |
| z2 | 2.9535 | .26 | 0.09060 | .12 | 1368.1 | 1395.7 | 1438.2 | 0.887 |
| z3 | 2.1456 | .13 | 0.09044 | .07 | 1023.4 | 1163.6 | 1434.9 | 0.828 |
Results of He Diffusion on Zodiac biotite, BT-1B
(Beartooth Gneiss) October 18, 2000
Kenneth A. Farley
Experiment:
Approximately 10 mg of biotite BT-1B, sieved to be between 75 and 100 µm, was subjected to step heating. Steps ranged in temperature from 50ºC to 500ºC in 50ºC increments, with an estimated uncertainty on T of < 3ºC. Durations ranged from 6 to 60 minutes, with longer durations at lower temperatures; uncertainty on time is < 1% for all steps. After the ten steps the partially degassed biotite was fused to establish the total amount of He in the sample. He was measured by isotope dilution quadrupole mass spectrometry, with an estimated precision of 2%. He diffusion coefficients were computed using the equations of Fechtig and Kalbitzer41 assuming spherical geometry.
Data—Table B1:
(In a later addendum to this report, Farley told us that the total amount of helium liberated was about 0.13 × 10⁻⁹ cm3 (at STP) per microgram of biotite.]
Interpretation:
He diffusion from this biotite defines a remarkably linear Arrhenius profile, fully consistent with thermally activated volume diffusion from this mineral. The first two data points lie slightly below the array; this is a common feature of He release during step heating of minerals and has been attributed to “edge effects” on the He concentration profile.42,43 Ignoring those two data points, the activation energy and diffusivity at infinite T based on these data are 25.7 kcal/mol and 752 respectively. At a cooling rate of 10ºC/Myr, these parameters correspond to a closure temperature of 39ºC.
(After this Farley added a “Recommendations” section wherein he discussed the possibility of vacuum breakdown of the biotite at high temperatures, the relevant effective radius for biotite [probably half the sieved flake diameter], and the source of helium in the biotite [probably uranium and thorium in zircons that had been in the flakes before separation]. We decided none of these questions were important enough to investigate in detail for now, since this sample was not from a site we were interested in at the time. It merely happened to be on hand at the ICR geology laboratory, making it ideal for an initial run to look for possible difficulties in experimental technique.)
Results of Helium Diffusion experiment on Zodiac biotite, GT2
(Jemez Granodiorite) March 24, 2001
Kenneth A. Farley
Experiment:
Approximately 10 mg of biotite GT2, sieved to be between 75 and 100 µm, was subjected to step heating. Steps ranged in temperature from 50ºC to 500ºC in 50ºC increments, with an estimated uncertainty on T of < 3ºC. Durations ranged from 7 to 132 minutes, with longer durations at lower temperatures; uncertainty on time is < 1% for all steps. After 11 steps of increasing T, the sample was brought back to lower temperature, and then heated in 6 more T-increasing steps. After the 17 steps the partially degassed biotite was fused to establish the total amount of He in the sample. He was measured by isotope dilution quadrupole mass spectrometry, with an estimated precision of 2% (steps 12 and 13 are much more uncertain owing to low gas yield). He diffusion coefficients were computed using the equations of Fechtig and Kalbitzer44 assuming spherical geometry.
| Step | TempºC | Minutes | Cumulative Fraction | lne(D/a2) |
|---|---|---|---|---|
| 1 | 50 | 61 | 1.61E–05 | –32.72 |
| 2 | 50 | 60 | 2.79E–05 | –32.01 |
| 3 | 100 | 60 | 2.39E–04 | –27.32 |
| 4 | 150 | 61 | 1.91E–03 | –23.18 |
| 5 | 200 | 61 | 4.70E–03 | –21.54 |
| 6 | 250 | 31 | 6.81E–03 | –20.59 |
| 7 | 300 | 31 | 9.69E–03 | –19.92 |
| 8 | 350 | 16 | 1.35E–02 | –18.63 |
| 9 | 400 | 15 | 2.44E–02 | –17.03 |
| 10 | 450 | 9 | 4.90E–02 | –15.05 |
| 11 | 500 | 7 | 1.07E–01 | –13.13 |
| 12 | 225 | 132 | 1.07E–01 | –22.12 |
| 13 | 275 | 61 | 1.07E–01 | –21.07 |
| 14 | 325 | 61 | 1.07E–01 | –19.70 |
| 15 | 375 | 60 | 1.10E–01 | –18.07 |
| 16 | 425 | 55 | 1.24E–01 | –16.15 |
| 17 | 475 | 61 | 1.99E–01 | –14.22 |
| Fusion | 8.00E–01 | |||
| Total | 1.00000 | |||
Data—Table B2:
(In a later addendum to this report, Farley told us that the total amount of helium liberated was about 0.32 × 10⁻⁹ cm3 [at STP] per microgram of biotite.)
Interpretation:
He diffusion in this sample follows a rather strange pattern, with a noticeable curve at intermediate temperatures. I have no obvious explanation for this phenomenon. Because biotite BT-1B did not show this curve, I doubt it is vacuum breakdown. I ran more steps, with a drop in temperature after the 500ºC step, to see if the phenomenon is reversible. It appears to be, that is, the curve appears again after the highest T step, but the two steps (12, 13) that define this curve had very low gas yield and high uncertainties. It is possible that we are dealing with more than one He source (multiple grain sizes or multiple minerals?). (We think it is likely there were some very small helium-bearing zircons still embedded in the biotite flakes, which would be one source. The other source would be the helium diffused out of larger zircons no longer attached to the flakes.) This sample had about twice as much helium as BT-1B. Note that despite the strange curvature in GT2, the two biotite samples have generally similar He diffusivity overall.
(The similarity Farley remarks upon made us decide that the biotite data were approximately correct. Because these data below 300ºC were also about an order of magnitude higher than our creation model, we supposed that zircon might be a more significant hindrance to helium loss than biotite, so we turned our attention to zircon. It turned out that our supposition was correct, which makes it less important to have exact biotite data.)
Appendix C: Diffusion Rates in Zircon
Below is a report by Kenneth Farley (again with our comments in brackets) on his measurements of helium diffusion in zircons extracted by Yakov Kapusta from Los Alamos National Laboratories core sample GT-2480 from borehole GT-2 in the Jemez Granodiorite at a depth of 750 m. Appendix A gives Kapusta’s radioisotopic analysis of three of the zircons. The rest, unsorted by size and labeled as sample YK-511, were forwarded to Farley for diffusion analysis. In Fig. 8, we have assumed an effective radius of 30 microns (or length 60 microns) and plotted the points (numbers 15–44) which Farley concludes below are the most reliable. These points only go down to 300ºC. In later publications we hope to report similar measurements down to 100ºC.
Report on Sample YK-511
(Jemez Granodiorite) May 14, 2002, Kenneth A. Farley
We step heated 0.35 mg of zircons from the large vial supplied by Zodiac. We verified that the separate was of high purity and was indeed zircon. The step heat consisted of 45 steps so as to better define the He release behavior. The first 15 steps were monotonically increasing in temperature, after that the temperature was cycled up and down several times.
Results:
(See Table C1 on next page.) The first 14 steps lie on a linear array corresponding to an activation energy of ~46 kcal/mol and a closure temperature of ~183ºC assuming a cooling rate of 10º C/Myr. However steps 15 to 44 (shown in Figs. 6(a) and 8), which were cycled from low to high temperature and back, lie on a shallower slope, corresponding to Ea = 34.5 kcal/mol and Tc = 128ºC. This change in slope from the initial run-up to the main body of the experiment is occasionally observed and attributed to either:
- A rounded He concentration profile in the zircons, such that the initial He release is anomalously retarded. In other words, the He concentration profile is shallower than the computational model used to estimate diffusivities assumes. This effect goes away as the experiment proceeds and the effects of the initial concentration profile become less significant. This rounding could be due to slow cooling or possibly to recent reheating.
- The change in slope might be due to changes in the zircons during the heating experiment. For example, it is possible that annealing of radiation damage has occurred. This sample has a very high He yield (540 nmol/g) so radiation damage is likely. However the zircons were only marginally within the window where radiation damage is thought to anneal in zircons, so this hypothesis is deemed less likely.
Consideration of geologic history and/or further experiments are necessary to firmly distinguish between these possibilities.
| Step | TempºC | Helium 4 (nmol/g) | Time (sec) | Fraction | Cumulative Fraction | D/a2 (sec–1) |
|---|---|---|---|---|---|---|
| 1 | 300 | 5.337083 | 3660 | 0.001259 | 0.001259 | 3.78E–11 |
| 2 | 300 | 1.316732 | 3660 | 0.000311 | 0.001570 | 2.10E–11 |
| 3 | 300 | 0.935963 | 3660 | 0.000221 | 0.001791 | 1.77E–11 |
| 4 | 325 | 3.719775 | 3660 | 0.000878 | 0.002669 | 9.34E–11 |
| 5 | 350 | 7.910044 | 3660 | 0.001867 | 0.004536 | 3.21E–10 |
| 6 | 375 | 18.12294 | 3660 | 0.004278 | 0.008815 | 1.36E–09 |
| 7 | 400 | 36 | 3660 | 0.008498 | 0.017313 | 5.29E–09 |
| 8 | 425 | 73.10049 | 3660 | 0.017256 | 0.034569 | 2.13E–08 |
| 9 | 450 | 106.0761 | 3660 | 0.025040 | 0.059609 | 5.85E–08 |
| 10 | 460 | 78.89137 | 1860 | 0.018623 | 0.078232 | 1.27E–07 |
| 11 | 470 | 96.99925 | 1860 | 0.022897 | 0.101130 | 2.08E–07 |
| 12 | 480 | 117.2479 | 1800 | 0.027677 | 0.128807 | 3.40E–07 |
| 13 | 490 | 146.8782 | 1860 | 0.034671 | 0.163479 | 5.38E–07 |
| 14 | 500 | 171.5538 | 1800 | 0.040496 | 0.203976 | 8.46E–07 |
| 15 | 453 | 149.5962 | 7200 | 0.035313 | 0.239290 | 2.31E–07 |
| 16 | 445 | 66.45767 | 7260 | 0.015687 | 0.254978 | 1.16E–07 |
| 17 | 400 | 9.589814 | 6840 | 0.002263 | 0.257241 | 1.86E–08 |
| 18 | 420 | 10.64711 | 3600 | 0.002513 | 0.259755 | 3.98E–08 |
| 19 | 440 | 23.19366 | 3660 | 0.005475 | 0.265230 | 8.69E–08 |
| 20 | 460 | 52.3035 | 3660 | 0.012346 | 0.277577 | 2.05E–07 |
| 21 | 480 | 102.7062 | 3660 | 0.024244 | 0.301821 | 4.38E–07 |
| 22 | 325 | 0.357828 | 3660 | 8.45E–05 | 0.301906 | 1.61E–09 |
| 23 | 350 | 0.718240 | 3660 | 0.000170 | 0.302075 | 3.23E–09 |
| 24 | 375 | 1.690889 | 3660 | 0.000399 | 0.302475 | 7.62E–09 |
| 25 | 400 | 4.246082 | 3660 | 0.001002 | 0.303477 | 1.92E–08 |
| 26 | 425 | 8 | 3660 | 0.001888 | 0.305365 | 3.64E–08 |
| 27 | 450 | 21 | 3660 | 0.004957 | 0.310323 | 9.70E–08 |
| 28 | 460 | 22.0839 | 1860 | 0.005213 | 0.315536 | 2.05E–07 |
| 29 | 470 | 33 | 1800 | 0.007789 | 0.323326 | 3.26E–07 |
| 30 | 480 | 45 | 1860 | 0.010622 | 0.333948 | 4.47E–07 |
| 31 | 490 | 62.39899 | 1800 | 0.014729 | 0.348678 | 6.75E–07 |
| 32 | 500 | 82.65262 | 1800 | 0.019510 | 0.368189 | 9.59E–07 |
| 33 | 475 | 120.222 | 7260 | 0.028379 | 0.396569 | 3.80E–07 |
| 34 | 445 | 45 | 7260 | 0.010622 | 0.407191 | 1.53E–07 |
| 35 | 400 | 5.879406 | 7260 | 0.001387 | 0.408579 | 2.05E–08 |
| 36 | 300 | 0.075983 | 3660 | 1.79E–05 | 0.408597 | 5.26E–10 |
| 37 | 320 | 0.685076 | 21660 | 0.000162 | 0.408759 | 8.02E–10 |
| 38 | 340 | 1.122111 | 18060 | 0.000265 | 0.409024 | 1.58E–09 |
| 39 | 360 | 1.986425 | 14460 | 0.000469 | 0.409493 | 3.49E–09 |
| 40 | 380 | 3.413768 | 10860 | 0.000806 | 0.410299 | 8.01E–09 |
| 41 | 400 | 5.752365 | 7260 | 0.001357 | 0.411657 | 2.03E–08 |
| 42 | 420 | 6.126626 | 3660 | 0.001446 | 0.413103 | 4.30E–08 |
| 43 | 440 | 13.67016 | 3600 | 0.003226 | 0.416330 | 9.85E–08 |
| 44 | 460 | 30.37821 | 3660 | 0.007171 | 0.423501 | 2.19E–07 |
Conclusion
The most reasonable conclusion from the data is that the main body of the experiment, steps 15–44, yields the best estimate of the closure temperature, about 130ºC. This is somewhat cooler than we have observed before in zircons though the database is not large. Radiation damage may be important in the He release kinetics from this He-rich sample.

Footnotes
- Cook, M. A. 1957. Where is the earth’s radiogenic helium? Nature 179:213.
- Vardiman, L. 1990. The age of the earth’s atmosphere: A study of the helium flux through the atmosphere, p. 28. El Cajon, California: Institute for Creation Research.
- Anonymous. 2000. Physics update. Physics Today 53, no. 8, part 1:9.
- Hoffman, J. H. and W. H. Dodson. 1980. Light ion concentrations and fluxes in the polar regions during magnetically quiet times. Journal of Geophysical Research 85, no. A2:626–632.
- Lie-Svendsen, Ø. and M. H. Rees. 1996. Helium escape from the terrestrial atmosphere: The ion outflow. Journal of Geophysical Research 101(A2):2435–2443.
- Zartman, R. E. 1979. Uranium, thorium and lead isotopic composition of biotite granodiorite (sample 9527-2b) from LASL Drill Hole GT-2. Los Alamos Science Laboratory Report LA-7923-MS.
- Gentry, R. V. private communication, December 31, 1995.
- Gentry, R. V., G. J. Glish, and E. H. McBay. 1982. Differential helium retention in zircons: Implications for nuclear waste management. Geophysical Research Letters 9, no. 10:1129–1130.
- Zartman, Ref. 6.
- Gentry, Ref. 7.
- Humphreys, D. R. 2000. Accelerated nuclear decay: A viable hypothesis? In Vardiman, L. A. A. Snelling, and E. F. Chaffin (eds.). Radioisotopes and the age of the earth: A young-earth creationist research initiative, pp. 333–379. San Diego, California: Institute for Creation Research and St. Joseph, Missouri: Creation Research Society.
- Girifalco, L. A. 1964. Atomic migration in crystals, pp. 39, 89. New York: Blaisdell Publishing Company.
- Girifalco, Ref. 12, p. 39, Fig. 23.
- Girifalco, Ref. 12, pp. 102, 126.
- Magomedov, Sh. A. 1970. Migration of radiogenic products in zircon. Geokhimiya, No. 2, pp. 263–267 (in Russian). English abstract in 1970. Geochemistry International, 7 no. 1:203. English translation available from D. R. Humphreys.
- Humphreys, Ref. 11, p. 347, Fig. 6.
- Humphreys, Ref. 11, pp. 346–348.
- Reiners, P. W., K. A. Farley, and H. J. Hickes. 2002. He diffusion and (U-Th)/He thermochronometry of zircon: Initial results from Fish Canyon Tuff and Gold Butte, Nevada. Tectonophysics 349:297–308.
- Zartman, Ref. 6.
- Lippolt, H. J. and E. Weigel. 1988. 4He diffusion in 40Ar-retentive minerals. Geochimica et Cosmochimica Acta 52:1449–1458.
- Magomedov, Ref. 15, p. 263.
- Bell, R. P. 1945. A problem of heat conduction with spherical symmetry. Proceedings of the Physical Society (London) 57:45–48.
- Carslaw, H. S. and J. C. Jaeger. 1959. Conduction of heat in solids, 2nd ed. Oxford: Clarendon Press.
- Crank, J. 1975. The mathematics of diffusion, 2nd ed, p. 8, equation 1.21. Oxford: Oxford University Press.
- Wolfram, S. 1991. Mathematica, 2nd ed. New York: Addison-Wesley.
- Humphreys, Ref. 11, p. 348, Fig. 7.
- Humphreys, Ref. 11, p. 346.
- Kolstad, C. D. and T. R. McGetchin. 1978. Thermal evolution models for the Valles Caldera with reference to a hot-dry-rock geothermal experiment. Journal of Volcanology and Geothermal Research 3:197–218.
- Harrison, T. M., P. Morgan, and D. D. Blackwell. 1986. Constraints on the age of heating at the Fenton Hill site, Valles Caldera, New Mexico. Journal of Geophysical Research 91(B2):1899–1908.
- Sakada, M. 1989. Fluid inclusion evidence for recent temperature increases at Fenton Hill hot dry rock test site west of the Valles Caldera, New Mexico, U. S. A. Journal of Volcanology and Geothermal Research 36:257–266.
- Harrison, Ref. 29, Fig. 9.
- Carslaw and Jaeger, Ref. 23, p. 232, Case VIII.
- Humphreys, Ref. 11, p. 348, Fig. 7.
- Magomedov, Ref. 15.
- Dodson, M. H. 1973. Closure temperature in cooling geochronological and petrological systems. Contributions to Mineralogy and Petrology 40:259–274.
- Humphreys, Ref. 11, p. 348, Fig. 7.
- Steiger, R. H. and E. Jäger, E. 1977. Subcommission on geochronology: convention on the use of decay constants in geo- and cosmochronology. Earth and Planetary Science Letters 36:359–362.
- Stacey, J. S. and J. D. Kramers. 1975. Approximation of terrestrial lead isotope evolution by a two-stage model. Earth and Planetary Science Letters 26:201–221.
- Zartman, Ref. 6.
- Lippolt and Weigel, Ref. 20.
- Fechtig, H. and S. Kalblitzer. 1966. The diffusion of argon in potassium-bearing solids. In Schaeffer, A. and J. Zähringer (eds.). Potassium argon dating. New York: Springer-Verlag.
- Farley, K. A. 2000. Helium diffusion from apatite: general behavior as illustrated by Durango Fluorapatite. Journal of Geophysical Research 105(B2):2903–2914.
- Fechtig and Kalbitzer, Ref. 41.
- Fechtig and Kalbitzer, Ref. 41.

Support the creation/gospel message by donating or getting involved!

Answers in Genesis is an apologetics ministry, dedicated to helping Christians defend their faith and proclaim the good news of Jesus Christ.
- Customer Service 800.778.3390
- Available Monday–Friday | 9 AM–5 PM ET
- © 2026 Answers in Genesis